Introduction – The Silent Upstream Failure
You’ve done everything right. Your embeddings are solid, your vector database is clean, and you’re using one of the best LLMs available. You write a query, hit enter, and the answer comes back – confident, fluent, and wrong.
Not obviously wrong. Plausibly wrong. The kind of wrong that makes it past a code review, into a demo, sometimes into production.
You dig into the retrieved chunks. The text is there, roughly. But the table that should show Q3 gross margin at 44.5% has its columns merged into noise. The handwritten annotation that changes the interpretation of a clause is garbled beyond recognition. The financial figure that should anchor the answer has been OCR’d into a completely different number.
The LLM didn’t hallucinate. It did exactly what you asked – it reasoned over the context it was given. The context was just broken.
This is the most common silent failure mode in RAG systems, and it almost never gets diagnosed correctly.
Developers reach for better chunking strategies, swap embedding models, tune retrieval parameters – all reasonable things to try, all pointed at the wrong problem. The issue isn’t downstream. It’s at the very first step, before any of those components ever see the data: document parsing.
Garbage in, garbage out. The entire RAG stack – embeddings, retrieval, generation – is only as good as the text the parser hands it. A state-of-the-art LLM cannot recover meaning from mangled input. It will confidently synthesize whatever it receives.
That’s what this article is about. Not RAG in the abstract, but the specific, underestimated problem of getting clean, structured, LLM-ready text out of real-world documents – PDFs with complex tables, scanned pages, mixed handwriting, dense layouts. Documents that traditional OCR tools were never designed to handle for machine consumption.
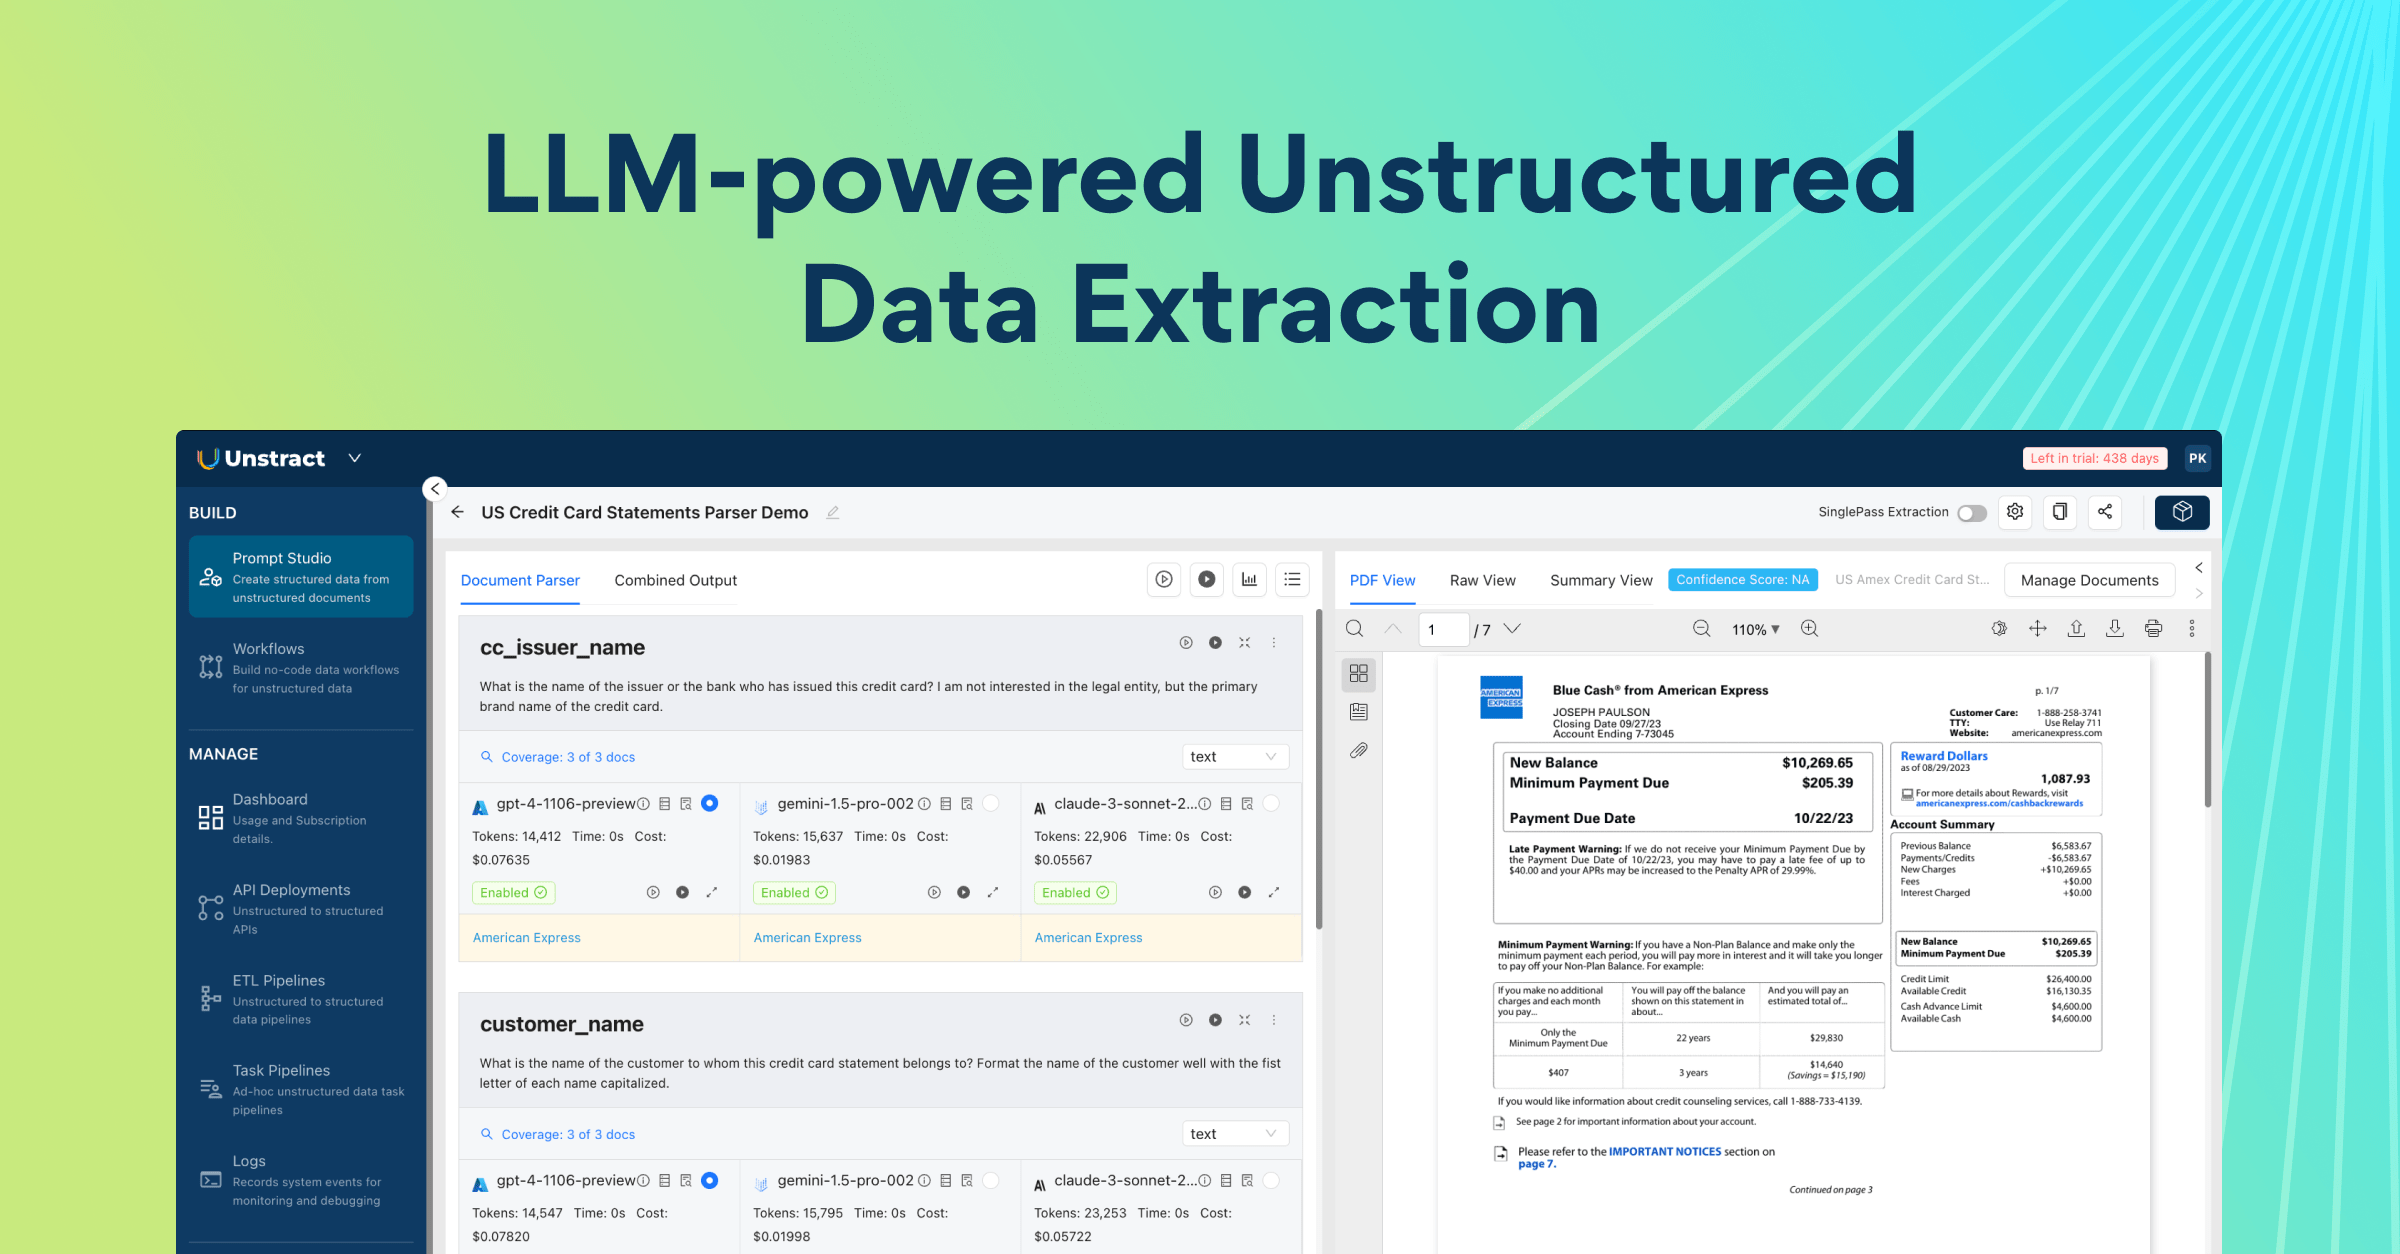
The tool we’ll be using is LLMWhisperer, Unstract’s document parsing engine built specifically for LLM workflows. Unlike general-purpose OCR, LLMWhisperer is designed with one goal: produce output that chunks predictably, embeds accurately, and retrieves correctly.
If you’ve ever had a RAG system that looked fine on paper and failed in practice, start here.
Part 1 – The RAG Pipeline & Where It Breaks
Section 1 – RAG in 60 Seconds
Retrieval-Augmented Generation is a pattern for giving LLMs access to knowledge they weren’t trained on.
Instead of relying on what the model has memorized, you retrieve relevant context from your own documents at query time and pass it to the model alongside the question. The LLM reasons over what you hand it – nothing more, nothing less.
The pipeline looks like this:
Raw Document → OCR/Parse → Chunk → Embed → Vector DB → Retrieve → LLM → Answer
Each stage has one job. The parser extracts text from the raw document. The chunker breaks that text into retrievable units. The embedding model converts each chunk into a vector. The vector database stores and indexes those vectors.
At query time, your question gets embedded the same way, the database finds the closest matching chunks, and those chunks get passed to the LLM as context for generating the answer.
It’s an elegant pipeline – and it’s only as strong as its weakest stage.
Three use cases illustrate why this matters at scale:
Enterprise financial documents: Quarterly earnings reports, 10-Ks, investor presentations – these are dense with tables, footnotes, and figures that analysts need to query quickly and accurately. A wrong number in a retrieved chunk isn’t a minor inconvenience; it’s a material error.
Legal contracts: Contracts live and die by precise language. Clause boundaries, defined terms, obligation structures – all of it needs to survive parsing intact for a RAG system to be trustworthy. A misread sentence can completely invert the meaning of an extracted obligation.
Medical records: Clinical notes combine typed text, handwritten annotations, structured lab values, and scanned forms – often in the same document. A RAG system querying patient history or treatment protocols needs all of it, legible and structurally coherent.
What these use cases share is that the documents are complex, the stakes of a wrong answer are high, and the parser is the first thing that can silently ruin everything.
Section 2 – Why Retrieval Quality Determines Generation Quality
There’s a tempting assumption baked into how most developers approach RAG systems: that a sufficiently capable LLM will compensate for imperfect retrieval. If the context is a bit noisy, surely the model is smart enough to figure out what matters.
It isn’t. And understanding why is the key to diagnosing most RAG failures.
An LLM operating in a RAG pipeline has no access to the original documents. It has no way to cross-reference what it received against what the document actually said. It cannot detect that a table column was merged during OCR, or that a number was misread, or that a paragraph was reconstructed in the wrong order. All it has is the context window you filled – and it will reason over that context as faithfully and confidently as it can, regardless of whether that context reflects reality.
This is not a flaw in the model. It’s the design. LLMs are built to make the best possible use of their input. Give a model clean, accurate context and that behaviour produces excellent answers. Give it broken context and that same behaviour produces fluent, well-structured, confidently wrong answers. The model isn’t hallucinating – it’s doing exactly what it was designed to do with the information it was given.
That’s what makes poor retrieval more dangerous than no retrieval. A system with no retrieved context will often hedge, admit uncertainty, or fall back on general knowledge. A RAG system with corrupted retrieved context will cite its sources and sound authoritative. The failure is invisible until someone checks the underlying document – which, in production, almost no one does on every query.
The practical implication is straightforward: LLM quality sets the ceiling; retrieval quality sets the floor. Upgrading to a more capable model when your retrieval is broken is like fitting a better engine to a car with flat tires. The bottleneck isn’t where you think it is.
Everything that follows in this article – the parsing demos, the pipeline walk-through, the queries – is an argument for fixing the floor first.
Section 3 – OCR Is Where Most RAG Pipelines Silently Fail
Cast your mind back to the pipeline from section 1:
Raw Document → OCR/Parse → Chunk → Embed → Vector DB → Retrieve → LLM → Answer
OCR/Parse is the second stage – right at the front, before chunking, before embedding, before any of the machinery developers spend most of their time tuning. Whatever errors are introduced here don’t stay here.
They propagate forward through every subsequent stage, silently, without triggering any exception or warning.
By the time a wrong answer surfaces at the end of the pipeline, the original sin is five steps upstream and rarely where anyone looks first.
What actually breaks:
The failure modes aren’t exotic. They show up constantly, on exactly the kinds of documents RAG systems are most commonly built to handle.
Mangled table columns: A financial report with a multi-column earnings table gets parsed into a flat stream of text. Column boundaries collapse. Numbers that belonged to Q2 end up adjacent to labels from Q3. The chunk looks like valid text, embeds without complaint, retrieves on a relevant query, and hands the LLM a set of figures that are internally consistent but factually scrambled.
Lost layout and reading order: Multi-column layouts, sidebars, and call-out boxes confuse parsers that read left-to-right across the full page width. A sentence from a sidebar gets stitched into the middle of the main body paragraph. The semantic coherence of the chunk breaks down in ways that are invisible to the embedding model but devastating to the answer.
Unreadable handwriting: Scanned forms, annotated contracts, clinical notes – any document with handwritten content is a gamble with traditional OCR. Characters get misread, words get dropped, entire annotations vanish. The parsed output looks like a complete document. The missing handwritten content never raises an error because the parser doesn’t know it was there.
Header and footer bleed: Page numbers, document titles, and running headers get pulled into the body text during extraction. Chunks get contaminated with repeated boilerplate that adds retrieval noise and, in dense documents, can push actual content out of the context window entirely.
Why traditional OCR was never built for this:
Traditional OCR tools were designed with a specific goal: produce output that a human can read. For that purpose, they work well enough. A human reading a parsed document can mentally reconstruct a mangled table, skip a misplaced header, and infer meaning from partially garbled handwriting.
Human readers are extraordinarily good at error correction.
Embedding models are not. They operate on the text as given. A mangled table doesn’t get mentally reconstructed – it gets encoded as a confused vector that will retrieve inconsistently. A misplaced header doesn’t get skipped – it shifts the semantic center of the chunk.
The output that was good enough for human reading is structurally wrong for machine consumption, and traditional OCR tools were never designed with that distinction in mind.
The silence is the problem:
What makes all of this particularly damaging in production is that none of it fails loudly. No exception is raised when a table column merges. No warning is logged when reading order is lost. The pipeline runs cleanly from end to end, returns a 200 OK, and delivers an answer that is subtly, plausibly, unflaggably wrong.
A system that throws an error when parsing fails is a system you can fix. A system that silently produces bad output is a system that erodes trust gradually, in ways that are hard to attribute and harder to reproduce. The user who gets the wrong gross margin figure probably doesn’t know the document well enough to catch it. The one who does may never report it. The bug lives in production indefinitely.
Fixing this requires addressing it where it actually originates – at the parsing layer, before the rest of the pipeline ever runs.
Section 4 – LLMWhisperer: OCR Built for the LLM Era
The distinction that matters here isn’t between good OCR and bad OCR. It’s between OCR designed for human readers and parsing designed for language models. LLMWhisperer is built around the second goal – which changes almost every design decision under the hood.
Developed by Unstract, LLMWhisperer is a document parsing API that takes real-world documents – scanned PDFs, native PDFs, mixed handwritten forms, complex layouts – and produces clean, structured text output optimized for LLM consumption. Not formatted for display. Not pretty-printed for a human reader. Structured so that it chunks predictably, embeds accurately, and retrieves correctly.
What makes it different:
Layout preservation: LLMWhisperer maintains the spatial relationships present in the original document. When content is arranged in columns, sections, or hierarchical structures, that organisation survives in the output. The reading order is correct. Related content stays adjacent. The structure that gives a document its meaning is reflected in the text the LLM receives.
Table integrity: This is where the gap between traditional OCR and LLMWhisperer is most visible. Rather than flattening tabular data into an unstructured stream, LLMWhisperer preserves row and column relationships in the output. Headers stay associated with their values. Multi-row cells don’t collapse. A table that contains the answer to a financial query arrives at the LLM as a table – not as a jumble of numbers stripped of their context.
Handwriting accuracy: LLMWhisperer handles documents that mix typed and handwritten content – scanned forms, annotated contracts, clinical notes – without treating the handwritten portions as noise to be approximated or dropped. Characters are resolved carefully, and the output reflects what the document actually contains rather than a best-guess approximation of the legible portions.
LLM-native output: The text LLMWhisperer produces is designed to be consumed by a language model, not rendered for a human. That means consistent structure, predictable white-space handling, and clean separation between document elements – exactly the properties that make downstream chunking reliable and embedding meaningful.
Seeing the difference:
The clearest argument for LLMWhisperer isn’t a feature list – it’s what the output actually looks like compared to what a traditional parser produces on the same document. Consider a scanned financial statement with a multi-column earnings table.
Traditional OCR output:
Revenue Net Income EPS Operating Margin
Q1 2023 94,836 24,160 1.52 Q2 2023 81,797 19,881
1.26 29.2% Q3 2023 89,498 22,956 1.46 28.7% 30.1%
The column boundaries are gone. Numbers that belong to separate rows are on the same line. Labels and values are interleaved without structure. An embedding model encodes this faithfully – as confusion. A retrieval query for Q3 operating margin will surface this chunk, hand it to the LLM, and the model will do its best with input that no longer contains a reliable answer
Now, consider the LLMWhisperer output on the same document:
                  Revenue      Net Income    EPS     Operating Margin
Q1 2023            94,836       24,160        1.52    30.1%
Q2 2023            81,797       19,881        1.26    29.2%
Q3 2023            89,498       22,956        1.46    28.7%
Row and column relationships intact. Headers aligned with their values. Each quarter’s figures unambiguously associated with the correct period. When this chunk is embedded and retrieved, the LLM receives the actual answer to the query – not a reconstruction problem.
That difference – clean structure versus collapsed noise – is what the rest of this article is built on. Better parsing isn’t a quality-of-life improvement. It’s the precondition for a RAG system that works.
Section 5 – Two Real Parsing Demos
The comparison in section 4 used a constructed example to illustrate the point cleanly. Here’s what LLMWhisperer does on real documents – the kind that break traditional OCR in practice.
LLMWhisperer OCR Demo 1 – Table-Heavy Document
The document below is complex commercial insurance application with multiple tables, nested headers, and data spread across several columns.
This is representative of what enterprise RAG systems encounter daily: structured numerical data where column integrity is everything.
Source document:
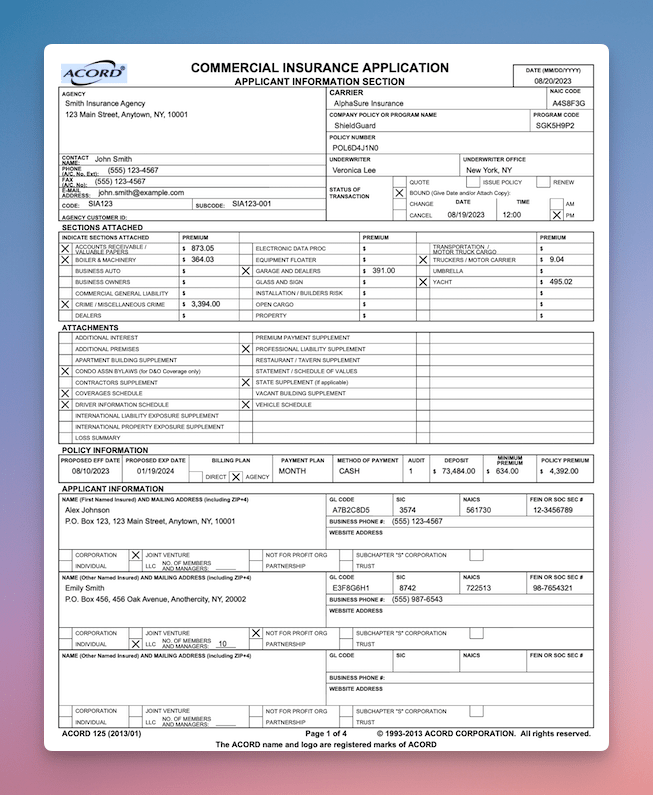
Run through a traditional OCR pipeline, the output collapses the table structure immediately. Column separators are lost, multi-row headers merge into adjacent cells, and figures drift away from their row labels.
The resulting text is parseable by a human who already knows what the table should look like – but not by an embedding model that has no such prior.
Processing the same document through LLMWhisperer’s playground tells a different story:
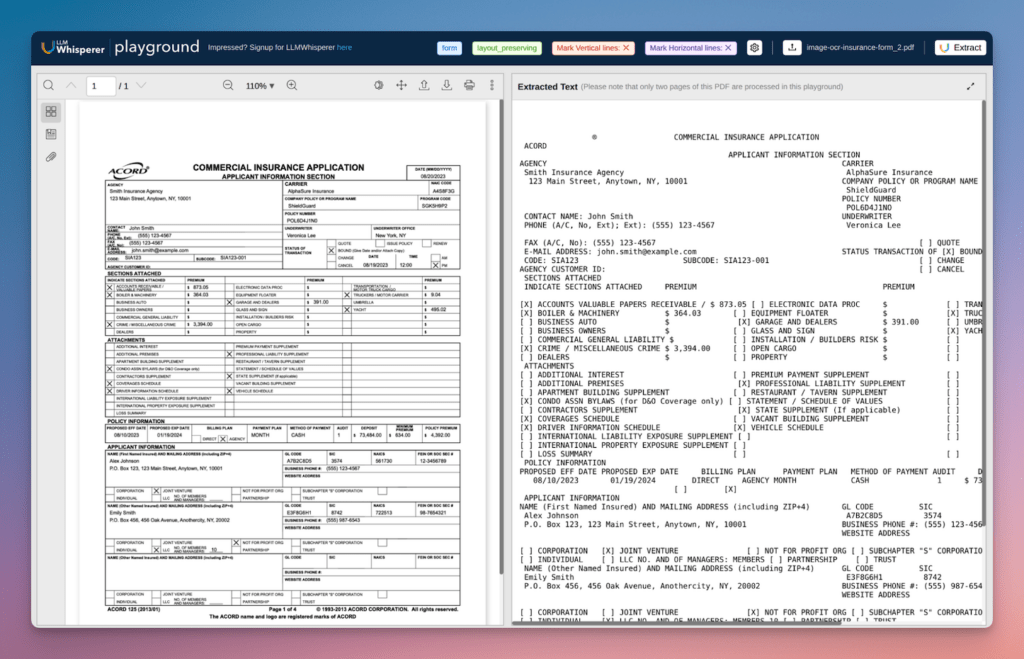
A few things worth calling out that aren’t obvious at first glance:
- Checkbox states are preserved and correctly bound to their labels: The
[X] BOUNDstatus and the selected sections under “Indicate Sections Attached” survive intact – critical for any downstream system querying policy status or coverage selection. Traditional OCR typically detaches checkbox markers from their adjacent text entirely - Two-column field layouts stay associated: The Agency/Carrier block runs two parallel columns across the full page width. LLMWhisperer maintains the left-right pairing – agency name opposite carrier name, address opposite policy details – rather than reading straight across and interleaving unrelated values
- Premium figures stay anchored to their line items: The sections attached table pairs coverage names with dollar amounts across several columns. The
$873.05figure stays with “Accounts Valuable Papers Receivable” and the$364.03with “Boiler & Machinery” – exactly the associations a RAG query on policy premiums needs to retrieve correctly
LLMWhisperer OCR Demo 2 – Handwritten Document
The second document is a scanned air waybill – photographed at a slight angle, filled out entirely by hand. Shipper details, consignee address, routing information, cargo line items, weights, rates, and charges.
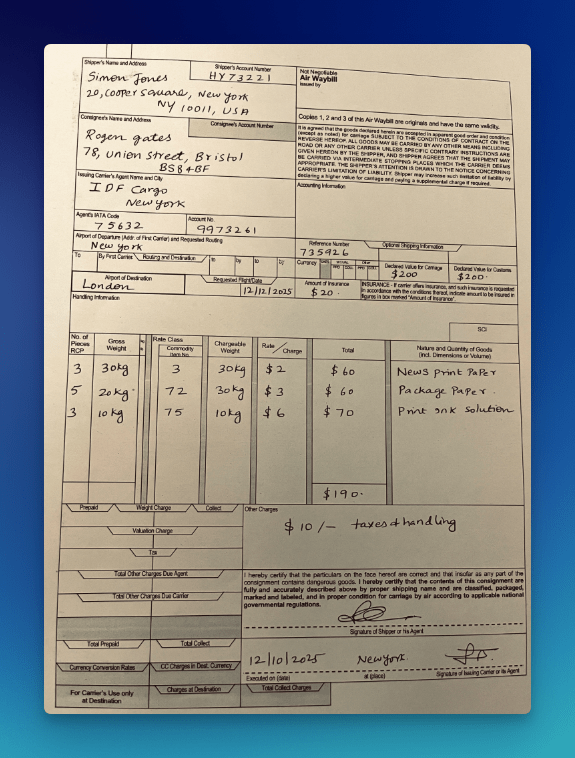
Traditional OCR output on this document does two things that look acceptable on the surface but are quietly destructive.
First, it misreads several handwritten characters – fours can become nines, cursive letter combinations might get dropped entirely.
Second, it loses the association between printed field labels and their handwritten values when the spatial alignment doesn’t conform to a clean grid.
The output contains text, but it’s no longer reliably connected to the structure that gave it meaning.
Processing the same document through LLMWhisperer’s playground tells again a different story:
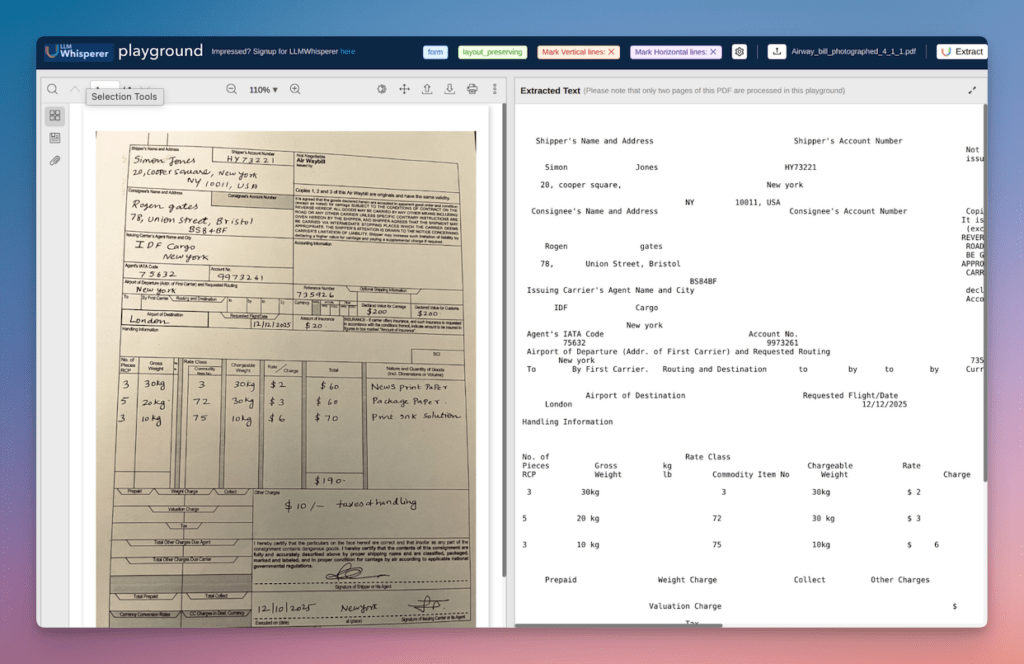
A few things worth calling out:
- The cargo table survives intact across all six columns: Each shipment line – pieces, gross weight, commodity code, chargeable weight, rate, and charge – stays on its own row with values correctly associated. This is the data a logistics RAG system would query most frequently, and it’s precisely what collapses first under traditional OCR when column boundaries are handwritten rather than ruled
- Shipper and consignee addresses are correctly separated: Despite being adjacent on the form, LLMWhisperer resolves the spatial boundary and keeps Simon Jones’s New York address distinct from Rogen Gates’s Bristol address – an association that breaks silently under a flat parse
- The date is read correctly as 12/12/2025: A common failure point on handwritten dates where day/month transposition or ambiguous digit reads (a handwritten 2 read as 7, for instance) produce a plausible but wrong value that no downstream component will flag
- Document skew doesn’t degrade output quality: The source photograph is visibly angled. The extracted text shows no artifacts from that skew – no mid-word line breaks, no characters dropped at the edge of a tilted column boundary
The output isn’t just more accurate. It’s structurally sound in a way that makes every downstream stage – chunking, embedding, retrieval – more reliable.
That’s the distinction LLMWhisperer is built around.
Part 2 – Building a RAG System with LLMWhisperer
What We’re Building & The Stack
The rest of this article is hands-on.
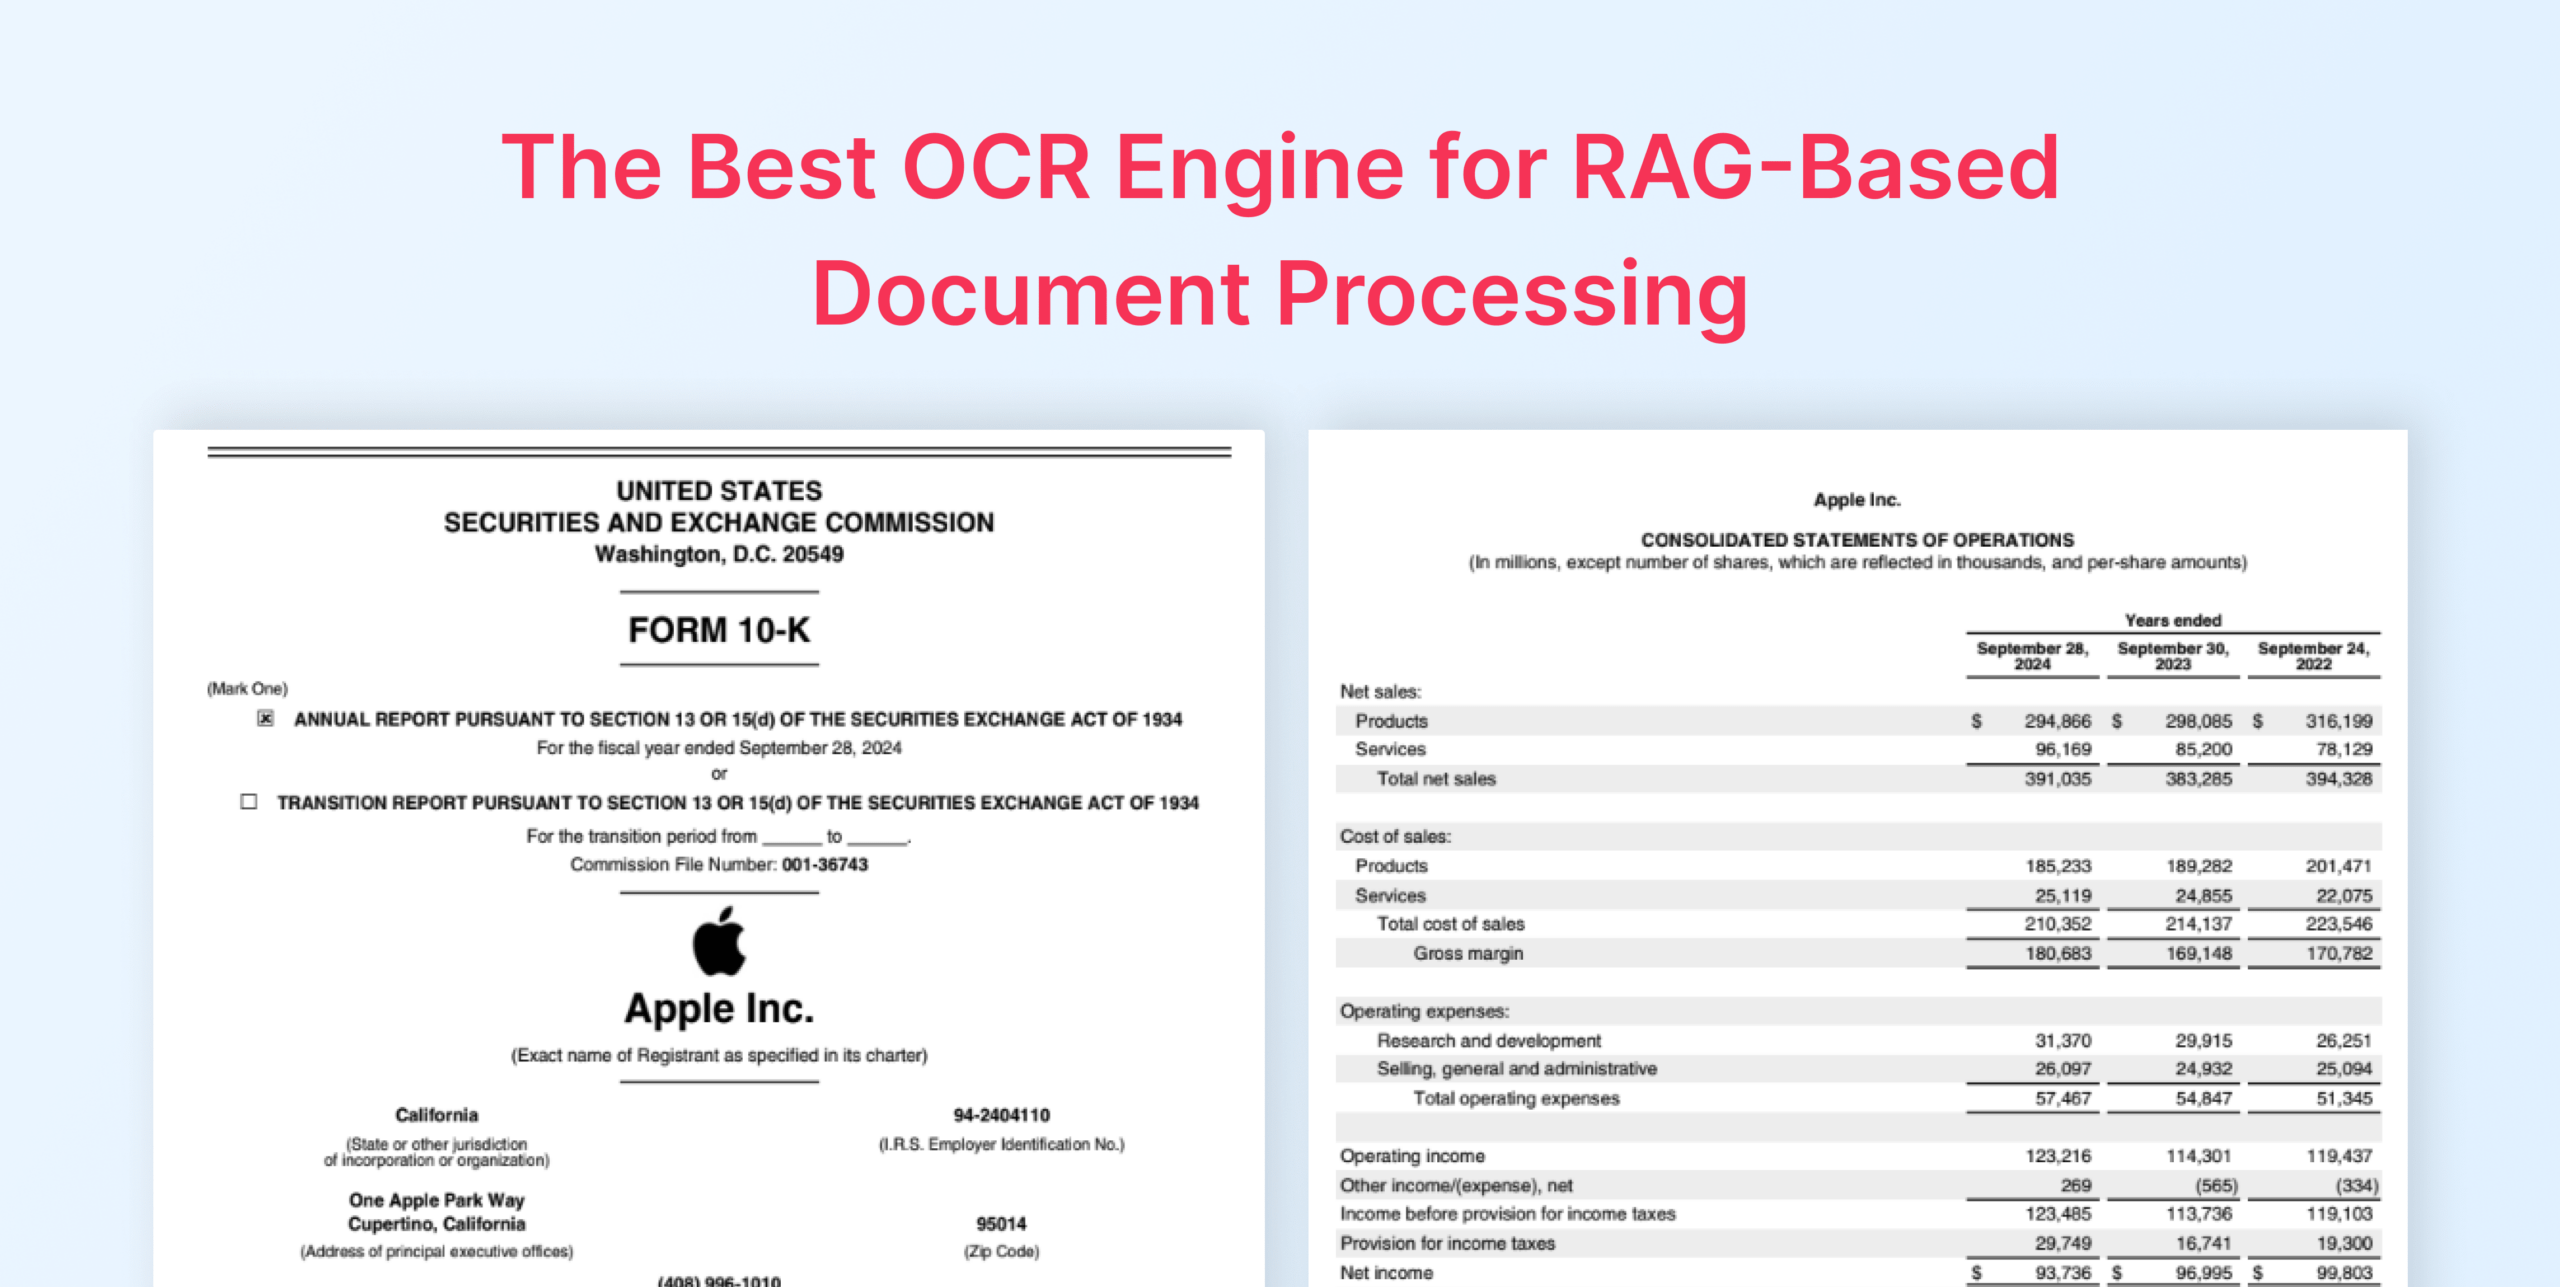
We’re going to build a working RAG system that answers questions from Apple’s financial documents – 10-Ks earnings reports, the kind of dense, table-heavy PDFs that put everything covered in Part 1 to the test.
Before writing a single line of code, it’s worth being explicit about a choice that most RAG tutorials skip: how much of the pipeline you build yourself.
Three valid approaches:
There’s a spectrum of implementation styles for a RAG system, and where you land on it should depend on your priorities – not on what the tutorial you’re following happened to choose.
Pure Python from scratch: You call LLMWhisperer directly, write your own chunking logic, call the OpenAI embeddings API directly, manage ChromaDB through its Python client, and assemble the retrieval and generation steps yourself. Maximum control, maximum visibility into every decision. The right choice when you need to understand exactly what’s happening at each stage, or when your use case requires chunking or retrieval logic that no framework anticipates. The trade-off is wiring: you own every integration point.
Python with select LlamaIndex or LangChain packages: You use framework components where they add genuine value – LlamaIndex’s node parsers for chunking, for example – without committing to the full framework abstraction. This is the middle ground: you get well-tested implementations of the tedious parts without surrendering visibility into the pipeline as a whole. Most production systems end up here eventually, even if they didn’t start there.
Fully leaning on LlamaIndex or LangChain: You express the entire pipeline through the framework’s abstractions – data loaders, index construction, query engines. Fastest to get running, least code to write, best integration with the framework’s ecosystem of connectors and tools. The tradeoff is opacity: when something goes wrong, the failure can be several abstraction layers away from where you’re looking.
None of these is the right answer in the abstract.
They represent different points on a control-versus-convenience spectrum, and the examples that follow sit in the middle: Python with select LlamaIndex components for chunking, direct API calls elsewhere.
That’s one valid choice.
The architecture can translate directly to either end of the spectrum if your context calls for it.
The stack:
For this build, we’re making one deliberate selection at each layer:
| Layer | Tool |
|---|---|
| Document parsing | LLMWhisperer |
| Chunking | LlamaIndex |
| Embeddings | OpenAI (text-embedding-3-small) |
| Vector database | ChromaDB |
| LLM | Claude (claude-sonnet-4-6) |
What you’ll need:
- An LLMWhisperer API key – a free tier is available
- An OpenAI API key for embeddings
- An Anthropic API key for generation
- Python 3.11+
- The AAPL financial documents we’ll be working with throughout Part 2
With the stack defined and the dependencies installed, we can walk through the pipeline stage by stage.
Pipeline Walkthrough: Step by Step
These are the documents used later in the pipeline: Apple 10-K 2024 and Apple 10-K 2025
First, let’s start by installing the dependencies:
pip install llmwhisperer-client llama-index-core
llama-index-embeddings-openai chromadb anthropic openai
Step 1 – Ingest with LLMWhisperer
The first stage converts the raw AAPL PDFs into clean, LLM-ready text.
LLMWhisperer exposes this through a straightforward Python client – you point it at a file, specify how you want it processed, and get back structured text that the rest of the pipeline can work with reliably.
# --- Step 1: Ingest the documents ---

from unstract.llmwhisperer import LLMWhispererClientV2
import os

# Initialize the LLMWhisperer client
client = LLMWhispererClientV2(api_key="<your_api_key>")

# Parse a document using the LLMWhisperer client
def parse_document(file_path: str) -> str:
    result = client.whisper(
        file_path=file_path,
        output_mode="layout_preserving",
        wait_for_completion=True,
        wait_timeout=300
    )
    return result["extraction"]["result_text"]

# Parse all AAPL documents
def parse_documents():
    # Create the parsed_docs directory if it doesn't exist
    if not os.path.exists("parsed_docs"):
        os.mkdir("parsed_docs")

    # Parse the documents
    parsed_docs = {}
    doc_dir = "aapl_documents/"
    for filename in os.listdir(doc_dir):
        if filename.endswith(".pdf"):
            # Process the document
            file_path = os.path.join(doc_dir, filename)
            parsed_docs[filename] = parse_document(file_path)
            print(f"Parsed: {filename} ({len(parsed_docs[filename])} chars)")
            # Save the parsed document to a file, with the same name as the original file but with the .txt extension
            with open(f"parsed_docs/{filename.replace('.pdf', '.txt')}", "w") as f:
                f.write(parsed_docs[filename])
            print(f"Saved: {filename.replace('.pdf', '.txt')}")
Watch out: output_mode matters more than it looks.
LLMWhisperer offers two output modes: layout_preserving and text.
For most RAG use cases, layout_preserving is the right default, since it maintains structural layout, preserves spatial relationships between elements, and strips unnecessary white-space to keep token counts lean. That’s the mode this pipeline uses, and it’s what produces the clean table output demonstrated in section 5 of part 1.
The text mode exists as a fallback. It extracts text without any structural processing or layout intelligence, which might be useful in edge cases where a document’s font complexity or unusual formatting causes layout_preserving to struggle.
Worth making the choice explicit in your ingestion code rather than leaving it as an implicit default, especially if your document corpus is mixed. A setting that works well for clean financial PDFs may not be the right call for every document type you add later.
Step 2 – Chunk with LlamaIndex
With clean text in hand, the next step is breaking it into retrievable units.LlamaIndex’s SentenceSplitter gives you reliable fixed-size chunking with overlap – a sensible default for financial documents where you want context to bleed across chunk boundaries without losing it entirely.
# --- Step 2: Chunk the documents ---
from llama_index.core import Document
from llama_index.core.node_parser import SentenceSplitter
import os
import json

# Chunk the documents into nodes
def chunk_documents() -> list:
    # Load the parsed documents
    parsed_docs = {}
    for filename in os.listdir("parsed_docs"):
        if filename.endswith(".txt"):
            with open(f"parsed_docs/{filename}", "r") as f:
                parsed_docs[filename] = f.read()
                print(f"Loaded: {filename}")

    # Split the documents into nodes using the SentenceSplitter
    splitter = SentenceSplitter(
        chunk_size=512,
        chunk_overlap=64,
    )

    all_nodes = []

    # Split the documents into nodes
    for filename, text in parsed_docs.items():
        # Create a document from the text
        document = Document(
            text=text,
            metadata={"source": filename}
        )
        # Split the document into nodes
        nodes = splitter.get_nodes_from_documents([document])

        # Attach chunk index to metadata
        for i, node in enumerate(nodes):
            node.metadata["chunk_index"] = i

        # Attach the nodes to the all_nodes list
        all_nodes.extend(nodes)
        print(f"{filename}: {len(nodes)} chunks")

    return all_nodes
Watch out: chunk size and financial tables are in tension.
A chunk_size of 512 tokens is a reasonable general-purpose default, but financial tables can be wider than that.
A table with ten columns and twenty rows will get split mid-table if your chunk boundary falls inside it – and a half-table is often worse than no table, because it looks complete but isn’t.
Two options worth considering: increase chunk_size to 1024 for document sets you know are table-heavy, or use LlamaIndex’s SemanticSplitter which attempts to respect semantic boundaries rather than cutting at fixed token counts.
The right choice depends on your documents; the wrong choice is not thinking about it at all.
Step 3 – Embed with OpenAI
Each chunk now needs to be converted into a vector.
We’ll use OpenAI’s text-embedding-3-small – a strong general-purpose embedding model that balances cost, speed, and retrieval quality.
# --- Step 3: Embed the documents ---
from openai import OpenAI
import time

# Define the OpenAI client
openai_client = OpenAI(api_key="your_api_key")

# Embed the nodes
def embed_nodes(nodes: list, batch_size: int = 100) -> list:
    embedded = []

    # Embed the nodes in batches
    for i in range(0, len(nodes), batch_size):
        batch = nodes[i:i + batch_size]
        texts = [node.get_content() for node in batch]

        # Embed the nodes using the OpenAI client
        response = openai_client.embeddings.create(
            model="text-embedding-3-small",
            input=texts,
        )

        # Attach the embedding to the node
        for node, embedding_data in zip(batch, response.data):
            embedded.append({
                "node": node,
                "embedding": embedding_data.embedding,
            })

        # Print the progress
        print(f"Embedded batch {i // batch_size + 1} / "
              f"{(len(nodes) + batch_size - 1) // batch_size}")

        # Avoid hitting rate limits on large corpora
        time.sleep(0.5)

    return embedded
Watch out: rate limits will bite you on large document sets.
OpenAI’s embeddings API enforces rate limits at both the requests-per-minute and tokens-per-minute level.
AAPL’s annual 10-K alone runs to hundreds of pages – embed the full corpus in one tight loop and you’ll hit a 429 (too many requests) partway through.
The time.sleep(0.5) above is a simple guard; for larger ingestion jobs, add proper exponential back off with retry logic, or use a library like tenacity to handle it cleanly.
It’s also worth caching embeddings to disk after the first run – re-embedding the entire corpus every time you restart the ingestion script is expensive and unnecessary.
Step 4 – Store in ChromaDB
With embeddings computed, now let’ persist everything to ChromaDB – vectors, text content, and the metadata that will let us trace every retrieved answer back to its source document, page, and chunk.
# --- Step 4: Store the embeddings ---
import chromadb

# Initialize the ChromaDB client
chroma_client = chromadb.PersistentClient(path="./chroma_store")

# Get or create the collection
collection = chroma_client.get_or_create_collection(
    name="aapl_financials",
    metadata={"hnsw:space": "cosine"},
)

# Store the embeddings in the ChromaDB collection
def store_embeddings(embedded_nodes: list) -> None:
    # Create the lists for the embeddings
    ids = []
    embeddings = []
    documents = []
    metadatas = []

    # Store the embeddings in the ChromaDB collection
    for i, item in enumerate(embedded_nodes):
        # Get the node
        node = item["node"]
        # Append the id
        ids.append(f"chunk_{i}")
        # Append the embedding
        embeddings.append(item["embedding"])
        # Append the document
        documents.append(node.get_content())
        # Append the metadata
        metadatas.append({
            "source": node.metadata.get("source", "unknown"),
            "chunk_index": node.metadata.get("chunk_index", i),
        })

    # Add the embeddings to the ChromaDB collection
    collection.add(
        ids=ids,
        embeddings=embeddings,
        documents=documents,
        metadatas=metadatas,
    )
    print(f"Stored {len(ids)} chunks in ChromaDB")
Watch out: design your metadata schema before you store anything.
The metadata you attach at ingestion time is the only way to trace a retrieved chunk back to its source at query time.
What you don’t store now, you can’t recover later without re-running the entire ingestion pipeline. At minimum, store the source filename and chunk index.
For production systems, consider also storing page number, document type (10-K vs. earnings release), and fiscal year – these become valuable filters when your corpus grows and users want answers scoped to a specific filing period.
Retrofitting metadata onto an existing ChromaDB collection means deleting and re-ingesting everything. Plan it once upfront.
With the final step in place, now the pipeline can be processed:
# --- Run the process ---
if __name__ == "__main__":
    print("Ingesting documents...")
    parse_documents()
    print("Documents ingested.")
    print("Chunking documents...")
    nodes = chunk_documents()
    print(f"Total chunks: {len(nodes)}")
    print("Embedding documents...")
    embedded_nodes = embed_nodes(nodes)
    print(f"Total embedded nodes: {len(embedded_nodes)}")
    print("Storing embeddings...")
    store_embeddings(embedded_nodes)
    print("Embeddings stored.")
Step 5 – Retrieve + Generate
The pipeline’s final stage: take a user query, embed it, retrieve the most relevant chunks from ChromaDB, and pass them to Claude as grounded context for generating the answer.
import anthropic
import openai
import chromadb

# Initialize the OpenAI client
openai_client = openai.OpenAI(api_key="<your_api_key>")

# Initialize the ChromaDB client
chroma_client = chromadb.PersistentClient(path="./chroma_store")

# Get or create the collection
collection = chroma_client.get_or_create_collection(
    name="aapl_financials",
    metadata={"hnsw:space": "cosine"},
)

# Initialize the Anthropic client
anthropic_client = anthropic.Anthropic(api_key="<your_api_key>")

# Retrieve the chunks from the ChromaDB collection
def retrieve(query: str, n_results: int = 5) -> list:
    # Embed the query using the OpenAI client
    query_embedding = openai_client.embeddings.create(
        model="text-embedding-3-small",
        input=[query],
    ).data[0].embedding

    # Query the ChromaDB collection
    results = collection.query(
        query_embeddings=[query_embedding],
        n_results=n_results,
        include=["documents", "metadatas", "distances"],
    )

    # Create the list for the chunks
    chunks = []
    # Iterate over the results
    for doc, meta, dist in zip(
        results["documents"][0],
        results["metadatas"][0],
        results["distances"][0],
    ):
        # Append the chunk to the list
        chunks.append({
            "text": doc,
            "source": meta.get("source"),
            "chunk_index": meta.get("chunk_index"),
            "score": round(1 - dist, 4),
        })

    return chunks

# Generate the answer to the question
def generate(query: str, chunks: list) -> str:
    # Create the context
    context = "\n\n---\n\n".join([
        f"[Source: {c['source']}, chunk {c['chunk_index']}]\n{c['text']}"
        for c in chunks
    ])

    # Create the prompt
    prompt = f"""You are a financial analyst assistant. Answer the question below
        using only the provided context from Apple's financial documents.

        For every specific figure or claim in your answer, cite the source chunk it
        came from using the format [Source: filename, chunk N].

        If the context does not contain enough information to answer the question
        confidently, say so explicitly -- do not infer or extrapolate.

        Context:
        {context}

        Question: {query}
    """

    # Generate the response
    response = anthropic_client.messages.create(
        model="claude-sonnet-4-6",
        max_tokens=1024,
        messages=[{"role": "user", "content": prompt}],
    )

    # Return the response
    return response.content[0].text


# Ask the question and return the answer
def ask(query: str) -> dict:
    chunks = retrieve(query)
    answer = generate(query, chunks)
    return {"query": query, "answer": answer, "sources": chunks}


# Run the query
if __name__ == "__main__":
    query = input("Enter your question: ")
    while query.lower() != "exit":
        answer = ask(query)
        print(answer)
        query = input("Enter your question: ")
Watch out: prompt structure is load-bearing for financial Q&A.
The instruction to cite source chunks is not optional polish – it’s what makes the system’s answers auditable.
Without explicit citation instructions, the model will synthesize across retrieved chunks and produce a clean answer that obscures which document it came from and whether the figures are reliable.
The equally important instruction is the last one: tell the model explicitly to admit uncertainty rather than extrapolate.
Financial RAG systems are often queried on specifics – exact figures, specific quarters, precise clause language – and a model that fills gaps confidently is more dangerous than one that says “the provided context doesn’t contain that figure.”
Build the epistemic guardrails into the prompt from the start.
The System in Action
With the pipeline assembled, here’s what it looks like to actually use it.
Three queries against the AAPL corpus – each testing a different retrieval characteristic.
Query 1 – Gross Margin
What was Apple's gross margin for 2024?
Answer:
## Apple's gross margin for 2024

Based on Apple's financial documents, here is a breakdown of the company's gross margin for fiscal year 2024.

### Gross margin (in millions)

| Segment | 2024 |
|---|---:|
| **Products** | $109,633 |
| **Services** | $71,050 |
| **Total gross margin** | **$180,683** |

[Source: Apple-10-Q4-2024-As-Filed.txt, chunk 51]

### Gross margin percentages

- **Products gross margin percentage**: 37.2%
- **Services gross margin percentage**: 73.9%
- **Total gross margin percentage**: 46.2%

[Source: Apple-10-Q4-2024-As-Filed.txt, chunk 51]

### Key drivers

- **Products gross margin** increased compared to 2023 due to **cost savings**, partially offset by a different product mix and weakness in foreign currencies relative to the U.S. dollar.
  [Source: Apple-10-Q4-2024-As-Filed.txt, chunk 51]
- **Services gross margin** increased compared to 2023 primarily due to **higher Services net sales**, with the margin percentage improvement driven by a different Services mix.
  [Source: Apple-10-Q4-2024-As-Filed.txt, chunk 52]
This is the query where parsing quality is most directly on the line and as you can see, it retrieved the relevant chunks:
[
{'text': 'iPhone \niPhone net sales were relatively flat during 2024 compared to 2023. \n\nMac \nMac net sales increased during 2024 compared to 2023 due primarily to higher net sales of laptops. \n\niPad \n\niPad net sales decreased during 2024 compared to 2023 due primarily to lower net sales of iPad Pro and the entry-level iPad \nmodels, partially offset by higher net sales of ipad Air. \n\nWearables, Home and Accessories \nWearables, Home and Accessories net sales decreased during 2024 compared to 2023 due primarily to lower net sales of \nWearables and Accessories. \n\nServices \n\nServices net sales increased during 2024 compared to 2023 due primarily to higher net sales from advertising, the App Store(r) \nand cloud services. \n\n Apple Inc. 2024 Form 10-K | 23 \n<<<\x0c\n\nGross Margin \nProducts and Services gross margin and gross margin percentage for 2024, 2023 and 2022 were as follows (dollars in millions): \n 2024 2023 2022 \n Gross margin: \n Products $ 109,633 $ 108,803 $ 114,728 \n Services 71,050 60,345 56,054 \n Total gross margin $ 180,683 $ 169,148 $ 170,782 \n\n Gross margin percentage: \n Products 37.2% 36.5% 36.3% \n Services 73.9% 70.8% 71.7% \n Total gross margin percentage 46.2% 44.1% 43.3% \n\n Products Gross Margin \n Products gross margin and Products gross margin percentage increased during 2024 compared to 2023 due to cost savings, \npartially offset by a different Products mix and the weakness in foreign currencies relative to the U.S. dollar. \n\n Services Gross Margin \n Services gross margin increased during 2024 compared to 2023 due primarily to higher Services net sales. \n\n Services gross margin percentage increased during 2024 compared to 2023 due to a different Services mix.', 'source': 'Apple-10-Q4-2024-As-Filed.txt', 'chunk_index': 51, 'score': 0.7136},
{'text': 'dollar. \n\n Services Gross Margin \n Services gross margin increased during 2024 compared to 2023 due primarily to higher Services net sales. \n\n Services gross margin percentage increased during 2024 compared to 2023 due to a different Services mix. \n\n The Company\'s future gross margins can be impacted by a variety of factors, as discussed in Part I, Item 1A of this Form 10-K \n under the heading "Risk Factors." As a result, the Company believes, in general, gross margins will be subject to volatility and \n downward pressure. \n\n Operating Expenses \n Operating expenses for 2024, 2023 and 2022 were as follows (dollars in millions): \n 2024 Change 2023 Change 2022 \n Research and development $ 31,370 5 % $ 29,915 14 % $ 26,251 \n Percentage of total net sales 8% 8% 7% \n Selling, general and administrative $ 26,097 5 % $ 24,932 (1)% $ 25,094 \n Percentage of total net sales 7% 7% 6% \n Total operating expenses $ 57,467 5 % $ 54,847 7 % $ 51,345 \n Percentage of total net sales 15% 14% 13% \n\n Research and Development \n The growth in R&D expense during 2024 compared to 2023 was driven primarily by increases in headcount-related expenses. \n\n Selling, General and Administrative \n Selling, general and administrative expense increased $1.2 billion during 2024 compared to 2023. \n\n Apple Inc.', 'source': 'Apple-10-Q4-2024-As-Filed.txt', 'chunk_index': 52, 'score': 0.6823},
{'text': 'Services \nServices net sales increased during 2025 compared to 2024 primarily due to higher net sales from advertising, the App Store \nand cloud services. \n\n Apple Inc. 2025 Form 10-K | 23 \n<<<\x0c\n\nGross Margin \nProducts and Services gross margin and gross margin percentage for 2025, 2024 and 2023 were as follows (dollars in millions): \n 2025 2024 2023 \nGross margin: \n Products $ 112,887 $ 109,633 $ 108,803 \n Services 82,314 71,050 60,345 \n Total gross margin $ 195,201 $ 180,683 $ 169,148 \n\nGross margin percentage: \n Products 36.8% 37.2% 36.5% \n Services 75.4% 73.9% 70.8% \n Total gross margin percentage 46.9% 46.2% 44.1% \n\nProducts Gross Margin \nProducts gross margin increased during 2025 compared to 2024 primarily due to favorable costs and a different mix of products, \npartially offset by tariff costs. \n\nProducts gross margin percentage decreased during 2025 compared to 2024 primarily due to a different mix of products and \ntariff costs, partially offset by other favorable costs. \n\nServices Gross Margin \nServices gross margin increased during 2025 compared to 2024 primarily due to higher Services net sales and a different mix of \nservices. \n\nServices gross margin percentage increased during 2025 compared to 2024 primarily due to a different mix of services, partially \noffset by higher costs. \n\nThe Company\'s future gross margins can be impacted by a variety of factors, as discussed in Part I, Item 1A of this Form 10-K \nunder the heading "Risk Factors." As a result, the Company believes, in general, gross margins will be subject to volatility and \ndownward pressure.', 'source': 'Apple_10-K-2025-As-Filed.txt', 'chunk_index': 52, 'score': 0.6733},
{'text': "As a result, the Company believes, in general, gross margins will be subject to volatility and \ndownward pressure. \n\nOperating Expenses \nOperating expenses for 2025, 2024 and 2023 were as follows (dollars in millions): \n 2025 Change 2024 Change 2023 \nResearch and development $ 34,550 10 % $ 31,370 5 % $ 29,915 \n Percentage of total net sales 8% 8% 8% \nSelling, general and administrative $ 27,601 6 % $ 26,097 5 % $ 24,932 \n Percentage of total net sales 7% 7% 7% \nTotal operating expenses $ 62,151 8 % $ 57,467 5 % $ 54,847 \n Percentage of total net sales 15% 15% 14% \n\nResearch and Development \nThe growth in R&D expense during 2025 compared to 2024 was primarily driven by increases in headcount-related expenses \nand infrastructure-related costs. \n\nSelling, General and Administrative \nThe growth in selling, general and administrative expense during 2025 compared to 2024 was primarily driven by increases in \nheadcount-related expenses and variable selling expenses. \n\n Apple Inc. 2025 Form 10-K | 24 \n<<<\x0c\n\nProvision for Income Taxes \nProvision for income taxes, effective tax rate and statutory federal income tax rate for 2025, 2024 and 2023 were as follows \n(dollars in millions): \n 2025 2024 2023 \n Provision for income taxes $ 20,719 $ 29,749 $ 16,741 \n Effective tax rate 15.6% 24.1% 14.7% \n Statutory federal income tax rate 21% 21% 21% \n\nThe Company's effective tax rate for 2025 was lower than the statutory federal income tax rate primarily due to a lower effective \ntax rate on foreign earnings, including the impact of changes in unrecognized tax benefits, the impact of the U.S.", 'source': 'Apple_10-K-2025-As-Filed.txt', 'chunk_index': 53, 'score': 0.665},
{'text': 'Selling, General and Administrative \n Selling, general and administrative expense increased $1.2 billion during 2024 compared to 2023. \n\n Apple Inc. 2024 Form 10-K 24 \n<<<\x0c\n\nProvision for Income Taxes \nProvision for income taxes, effective tax rate and statutory federal income tax rate for 2024, 2023 and 2022 were as follows \n(dollars in millions): \n 2024 2023 2022 \n Provision for income taxes $ 29,749 $ 16,741 $ 19,300 \n Effective tax rate 24.1% 14.7% 16.2% \n Statutory federal income tax rate 21% 21% 21% \n\nThe Company\'s effective tax rate for 2024 was higher than the statutory federal income tax rate due primarily to a one-time \nincome tax charge of $10.2 billion, net, related to the State Aid Decision (refer to Note 7, "Income Taxes" in the Notes to \nConsolidated Financial Statements in Part II, Item 8 of this Form 10-K) and state income taxes, partially offset by a lower \neffective tax rate on foreign earnings, the impact of the U.S. federal R&D credit, and tax benefits from share-based \ncompensation. \n\nThe Company\'s effective tax rate for 2024 was higher compared to 2023 due primarily to a one-time income tax charge of \n$10.2 billion, net, related to the State Aid Decision, a higher effective tax rate on foreign earnings and lower tax benefits from \nshare-based compensation. \n\nLiquidity and Capital Resources \nThe Company believes its balances of unrestricted cash, cash equivalents and marketable securities, which totaled $140.8 billion \nas of September 28, 2024, along with cash generated by ongoing operations and continued access to debt markets, will be \nsufficient to satisfy its cash requirements and capital return program over the next 12 months and beyond.', 'source': 'Apple-10-Q4-2024-As-Filed.txt', 'chunk_index': 53, 'score': 0.6527}
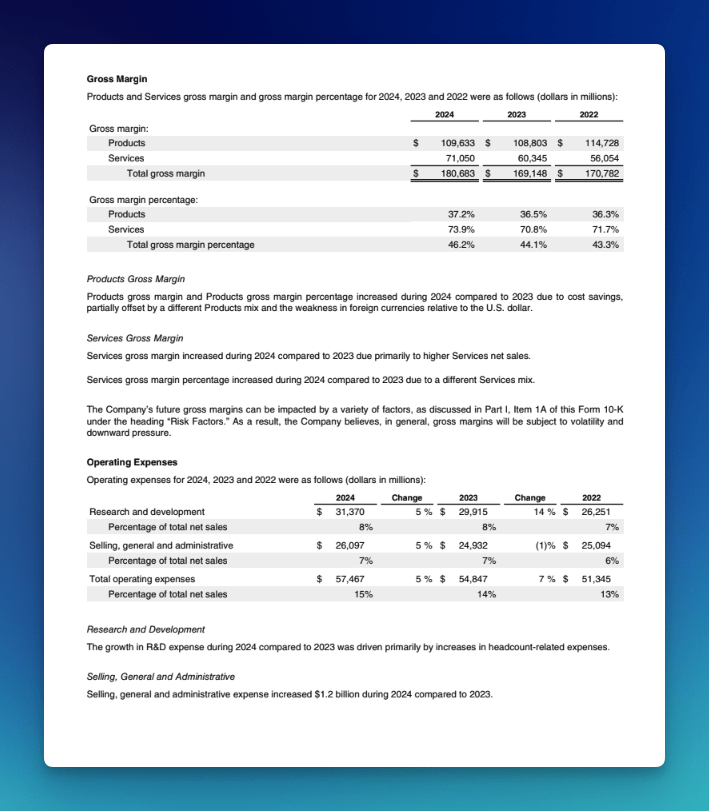
]The answer is anchored entirely in a multi-column table spanning three fiscal years and two business segments, exactly the structure that collapses under traditional OCR.
Five chunks were retrieved in total, including data from the 2025 10-K which also contains the 2024 figures for cross-reference.
The model cited chunk 51 as the primary source, correctly distinguished Products margin from Services margin, and pulled the year-over-year commentary from chunk 52 without conflating the two.
Both rows survived parsing intact, which is the only reason any of that was possible.
Query 2 – Supply Chain Risk Factors
What supply chain risks does Apple identify in its most recent 10-K?
Answer:
## Apple's Supply Chain Risks (2025 10‑K)

Based on Apple's 2025 10‑K, the company highlights several supply chain risks that could materially impact operations, financial results, and product availability.

### Key risks

1. **Component shortages and price increases**
   - Apple may be unable to renew supply agreements on similar terms, or may not be able to source sufficient quantities on time.
   - Suppliers may **fail/consolidate** or prioritize **common components** over Apple-specific/customized parts.
   - Apple notes this can lead to **supply shortages and price increases** that could materially adversely affect the business.
     - Source: `Apple_10-K-2025-As-Filed.txt` (chunk 21)

2. **Reliance on outsourcing/manufacturing partners**
   - Most manufacturing is performed by partners primarily in **mainland China, India, Japan, South Korea, Taiwan, and Vietnam**.
   - Production is often concentrated among a **small number of partners** and sometimes **single locations**, reducing resiliency.
   - Risks include reduced direct control, potential quality/defect liabilities, and supplier code-of-conduct issues.
     - Source: `Apple-10-Q4-2024-As-Filed.txt` (chunk 19)

3. **Single-source dependencies**
   - Apple depends on **single-source partners** for certain components and manufacturing steps.
   - A disruption or underperformance by a single-source supplier can directly affect cost, supply, and production continuity.
     - Source: `Apple-10-Q4-2024-As-Filed.txt` (chunk 19)

4. **Geographic and logistics disruption**
   - Manufacturing and logistics may be disrupted by:
     - Natural/man-made disasters
     - IT/system failures
     - Geopolitical tensions/conflict
     - Trade and international disputes
     - Public health or political instability
   - Source: `Apple-10-Q4-2024-As-Filed.txt` (chunk 19)

5. **Custom component availability constraints**
   - New products and differentiated features may depend on **custom components** and **new technologies** with limited initial capacity.
   - Some parts may be available from **only one source**, and supply can tighten if vendors shift toward common components.
     - Source: `Apple-10-Q4-2024-As-Filed.txt` (chunk 95)

6. **Exposure to global/regional economic conditions**
   - Because many supplier facilities are outside the U.S., Apple's supply chain performance is sensitive to **global and regional economic conditions**.
   - Source: `Apple_10-K-2025-As-Filed.txt` (chunk 12)

### Summary

Overall, Apple emphasizes supply chain risk from **concentration (geographic and supplier)**, **single-source dependencies**, **outsourced manufacturing control limits**, and **macro/logistics disruptions**.
Several chunks contributed to a coherent answer:
[

{'text': "The Company may not be able to extend or renew agreements for the supply of \ncomponents on similar terms, or at all, and may not be successful in obtaining sufficient quantities from its suppliers in a timely \nmanner, or in identifying and obtaining sufficient quantities from an alternative source. In addition, component suppliers may fail, \nbe subject to consolidation within a particular industry, or decide to concentrate on the production of common components \ninstead of components customized to meet the Company's requirements, further limiting the Company's ability to obtain sufficient \nquantities of components on commercially reasonable terms, or at all. Therefore, the Company remains subject to significant \nrisks of supply shortages and price increases that can materially adversely affect its business, results of operations, financial \ncondition and stock price. \n\n                                                 Apple Inc. 2025 Form 10-K | 8 \n<<<\x0c\n\nThe Company's products and services may be affected from time to time by design and manufacturing defects that could \nmaterially adversely affect the Company's business and result in harm to the Company's reputation. \nThe Company offers complex hardware and software products and services that can be affected by design and manufacturing \ndefects. Sophisticated operating system software and applications, such as those offered by the Company, often have issues \nthat can unexpectedly interfere with the intended operation of hardware or software products and services. Defects can also exist \nin components and products the Company purchases from third parties. Component defects could make the Company's \nproducts unsafe and create a risk of environmental or property damage and personal injury. These risks may increase as the \nCompany's products are introduced into specialized applications, including health. In addition, the Company's service offerings \ncan have quality issues and from time to time experience outages, service slowdowns or errors. As a result, from time to time the \nCompany's services have not performed as anticipated and may not meet customer expectations. The introduction of new and \ncomplex technologies, such as artificial intelligence features, can increase these and other safety risks, including exposing users \nto harmful, inaccurate or other negative content and experiences. The Company may not be able to detect and fix all issues and \ndefects in the hardware, software and services it offers, which can result in widespread technical and performance issues \naffecting the Company's products and services.", 'source': 'Apple_10-K-2025-As-Filed.txt', 'chunk_index': 21, 'score': 0.702},

{'text': 'The Company periodically provides certain information for investors on its \ncorporate website, www.apple.com, and its investor relations website, investor.apple.com. This includes press releases and \nother information about financial performance, information on corporate governance, and details related to the Company\'s \nannual meeting of shareholders. The information contained on the websites referenced in this Form 10-K is not incorporated by \nreference into this filing. Further, the Company\'s references to website URLs are intended to be inactive textual references only. \n\n                                                Apple Inc. 2025 Form 10-K | 4 \n<<<\x0c\n\nItem 1A.   Risk Factors \n\nThe following summarizes factors that could have a material adverse effect on the Company\'s business, reputation, results of \noperations, financial condition and stock price. The Company may not be able to accurately predict, control or mitigate these \nrisks. Statements in this section are based on the Company\'s beliefs and opinions regarding matters that could materially \nadversely affect the Company in the future and are not representations as to whether such matters have or have not occurred \npreviously. The risks and uncertainties described below are not exhaustive and should not be considered a complete statement \nof all potential risks or uncertainties that the Company faces or may face in the future. \n\nThis section should be read in conjunction with Part II, Item 7, "Management\'s Discussion and Analysis of Financial Condition \nand Results of Operations" and the consolidated financial statements and accompanying notes in Part II, Item 8, "Financial \nStatements and Supplementary Data" of this Form 10-K. \n\nMacroeconomic and Industry Risks \n\nThe Company\'s operations and performance depend significantly on global and regional economic conditions and \nadverse economic conditions can materially adversely affect the Company\'s business, results of operations, financial \ncondition and stock price. \nThe Company has international operations with sales outside the U.S. representing a majority of the Company\'s total net sales. \nIn addition, the Company\'s global supply chain is large and complex and a majority of the Company\'s supplier facilities, including \nmanufacturing and assembly sites, are located outside the U.S. As a result, the Company\'s operations and performance depend \nsignificantly on global and regional economic conditions.', 'source': 'Apple_10-K-2025-As-Filed.txt', 'chunk_index': 12, 'score': 0.7003},

{'text': 'Health and Safety \nThe Company is committed to protecting its team members everywhere it operates. The Company identifies potential workplace \nrisks in order to develop measures to mitigate possible hazards. The Company supports employees with general safety, security \nand crisis management training, and by putting specific programs in place for those working in potentially high-hazard \nenvironments. Additionally, the Company works to protect the safety and security of its team members, visitors and customers \nthrough its global security team. \n\n                                                Apple Inc. 2024 Form 10-K | 4 \n<<<\x0c\n\nAvailable Information \nThe Company\'s Annual Reports on Form 10-K, Quarterly Reports on Form 10-Q, Current Reports on Form 8-K, and \namendments to reports filed pursuant to Sections 13(a) and 15(d) of the Securities Exchange Act of 1934, as amended (the \n"Exchange Act"), are filed with the U.S. Securities and Exchange Commission (the "SEC"). Such reports and other information \nfiled by the Company with the SEC are available free of charge at investor.apple.com/investor-relations/sec-filings/default.aspx \nwhen such reports are available on the SEC\'s website. The Company periodically provides certain information for investors on its \ncorporate website, www.apple.com, and its investor relations website, investor.apple.com. This includes press releases and \nother information about financial performance, information on environmental, social and governance matters, and details related \nto the Company\'s annual meeting of shareholders. The information contained on the websites referenced in this Form 10-K is not \nincorporated by reference into this filing. Further, the Company\'s references to website URLs are intended to be inactive textual \nreferences only. \n\nItem 1A.   Risk Factors \n\nThe Company\'s business, reputation, results of operations, financial condition and stock price can be affected by a number of \nfactors, whether currently known or unknown, including those described below. When any one or more of these risks materialize \nfrom time to time, the Company\'s business, reputation, results of operations, financial condition and stock price can be materially \nand adversely affected.', 'source': 'Apple-10-Q4-2024-As-Filed.txt', 'chunk_index': 12, 'score': 0.6819},

{'text': "Apple Inc. 2024 Form 10-K | 7 \n<<<\x0c\n\nThe Company depends on component and product manufacturing and logistical services provided by outsourcing \npartners, many of which are located outside of the U.S. \nSubstantially all of the Company's manufacturing is performed in whole or in part by outsourcing partners located primarily in \nChina mainland, India, Japan, South Korea, Taiwan and Vietnam, and a significant concentration of this manufacturing is \ncurrently performed by a small number of outsourcing partners, often in single locations. The Company has also outsourced \nmuch of its transportation and logistics management. While these arrangements can lower operating costs, they also reduce the \nCompany's direct control over production and distribution. Such diminished control has from time to time and may in the future \nhave an adverse effect on the quality or quantity of products manufactured or services provided, or adversely affect the \nCompany's flexibility to respond to changing conditions. Although arrangements with these partners may contain provisions for \nproduct defect expense reimbursement, the Company generally remains responsible to the consumer for warranty and out-of- \nwarranty service in the event of product defects and experiences unanticipated product defect liabilities from time to time. While \nthe Company relies on its partners to adhere to its supplier code of conduct, violations of the supplier code of conduct occur from \ntime to time and can materially adversely affect the Company's business, reputation, results of operations and financial condition. \n\nThe Company relies on single-source outsourcing partners in the U.S., Asia and Europe to supply and manufacture many \ncomponents, and on outsourcing partners primarily located in Asia, for final assembly of substantially all of the Company's \nhardware products. Any failure of these partners to perform can have a negative impact on the Company's cost or supply of \ncomponents or finished goods. In addition, manufacturing or logistics in these locations or transit to final destinations can be \ndisrupted for a variety of reasons, including natural and man-made disasters, information technology system failures, commercial \ndisputes, economic, business, labor, environmental, public health or political issues, trade and other international disputes, \ngeopolitical tensions, or conflict. \n\nThe Company has invested in manufacturing process equipment, much of which is held at certain of its outsourcing partners, \nand has made prepayments to certain of its suppliers associated with long-term supply agreements.", 'source': 'Apple-10-Q4-2024-As-Filed.txt', 'chunk_index': 19, 'score': 0.6791},

{'text': "The Company's unconditional purchase obligations primarily consist of supplier \narrangements, licensed intellectual property and content, and distribution rights. Future payments under unconditional purchase \nobligations with a remaining term in excess of one year as of September 28, 2024, are as follows (in millions): \n2025                                                                                                 $        3,206 \n2026                                                                                                          2,440 \n2027                                                                                                          1,156 \n2028                                                                                                          3,121 \n2029                                                                                                            633 \nThereafter                                                                                                      670 \n    Total                                                                                            $       11,226 \n\n                                             Apple Inc. 2024 Form 10-K | 45 \n<<<\x0c\n\nContingencies \nThe Company is subject to various legal proceedings and claims that have arisen in the ordinary course of business and that \nhave not been fully resolved. The outcome of litigation is inherently uncertain. In the opinion of management, there was not at \nleast a reasonable possibility the Company may have incurred a material loss, or a material loss greater than a recorded accrual, \nconcerning loss contingencies for asserted legal and other claims. \n\nConcentrations in the Available Sources of Supply of Materials and Product \nAlthough most components essential to the Company's business are generally available from multiple sources, certain \ncomponents are currently obtained from single or limited sources. The Company also competes for various components with \nother participants in the markets for smartphones, personal computers, tablets, wearables and accessories. Therefore, many \ncomponents used by the Company, including those that are available from multiple sources, are at times subject to industry-wide \nshortage and significant commodity pricing fluctuations. \n\nThe Company uses some custom components that are not commonly used by its competitors, and new products introduced by \nthe Company often utilize custom components available from only one source. When a component or product uses new \ntechnologies, initial capacity constraints may exist until the suppliers' yields have matured or their manufacturing capacities have \nincreased. The continued availability of these components at acceptable prices, or at all, may be affected if suppliers decide to \nconcentrate on the production of common components instead of components customized to meet the Company's requirements. \n\nSubstantially all of the Company's hardware products are manufactured by outsourcing partners that are located primarily in \nChina mainland, India, Japan, South Korea, Taiwan and Vietnam.", 'source': 'Apple-10-Q4-2024-As-Filed.txt', 'chunk_index': 95, 'score': 0.6703}

]
This is a different retrieval challenge from Query 1.
There’s no table to parse, the answer is distributed across multiple risk factor sections written in dense legal prose.
What matters here is that the chunk boundaries didn’t cut through a disclosure mid-sentence, and that semantically related risk categories landed in retrievable proximity to each other.
Five chunks, six distinct risk categories, each citation traceable to its source.
Query 3 – iPhone Revenue Trend
How has iPhone revenue trended across the last three reported quarters?
Answer:
## iPhone Revenue Trend (What the provided context supports)

The available context supports **annual (fiscal-year)** iPhone net sales, but it does **not** include a **quarter-by-quarter** iPhone revenue breakdown. So I can summarize the annual trend, but I cannot accurately answer "last three reported quarters" from the current context alone.

### Annual iPhone net sales (fiscal year)

| Fiscal Year | iPhone Net Sales (\$M) | YoY Change |
|---|---:|---:|
| FY 2022 | 205,489 | -- |
| FY 2023 | 200,583 | ~\(2\)% |
| FY 2024 | 201,183 | ~0% |
| FY 2025 | 209,586 | ~+4% |

Sources: `Apple_10-K-2025-As-Filed.txt` (chunk 71); `Apple-10-Q4-2024-As-Filed.txt` (chunk 50)

### Key observations (annual)

- **FY2022 → FY2023**: iPhone net sales **declined** by ~2%
  - Source: `Apple-10-Q4-2024-As-Filed.txt` (chunk 50)
- **FY2023 → FY2024**: iPhone net sales were **roughly flat**
  - Source: `Apple-10-Q4-2024-As-Filed.txt` (chunk 50)
- **FY2024 → FY2025**: iPhone net sales **grew** to **\$209,586M** (~+4%)
  - Source: `Apple_10-K-2025-As-Filed.txt` (chunk 71)

### Limitation / what's missing for "last three quarters"

The question asks for the **last three reported quarters**, but the provided context here is **annual** (10‑K / fiscal-year) iPhone net sales, not quarterly iPhone net sales by quarter. To answer the quarterly trend, we'd need iPhone net sales data from the relevant **10‑Q** filings (or another quarterly breakdown) that is not included in the current context.
Several chunk containing a multi-period product revenue table was sufficient to answer a trend question:
[

{'text': 'Total net sales include $7.7 billion of revenue recognized in 2024 that was included in deferred revenue as of September 30, \n2023, $8.2 billion of revenue recognized in 2023 that was included in deferred revenue as of September 24, 2022, and $7.5 \nbillion of revenue recognized in 2022 that was included in deferred revenue as of September 25, 2021. \n\n                                                 Apple Inc. 2024 Form 10-K | 35 \n<<<\x0c\n\nThe Company\'s proportion of net sales by disaggregated revenue source was generally consistent for each reportable segment \nin Note 13, "Segment Information and Geographic Data" for 2024, 2023 and 2022, except in Greater China, where iPhone \nrevenue represented a moderately higher proportion of net sales. \n\nAs of September 28, 2024 and September 30, 2023, the Company had total deferred revenue of $12.8 billion and $12.1 billion, \nrespectively. As of September 28, 2024, the Company expects 64% of total deferred revenue to be realized in less than a year, \n25% within one-to-two years, 9% within two-to-three years and 2% in greater than three years.', 'source': 'Apple-10-Q4-2024-As-Filed.txt', 'chunk_index': 70, 'score': 0.5982},

{'text': 'Greater China \nGreater China net sales decreased during 2024 compared to 2023 due primarily to lower net sales of iPhone and iPad. The \nweakness in the renminbi relative to the U.S. dollar had an unfavorable year-over-year impact on Greater China net sales during \n2024. \n\nJapan \nJapan net sales increased during 2024 compared to 2023 due primarily to higher net sales of iPhone. The weakness in the yen \nrelative to the U.S. dollar had an unfavorable year-over-year impact on Japan net sales during 2024. \n\nRest of Asia Pacific \nRest of Asia Pacific net sales increased during 2024 compared to 2023 due primarily to higher net sales of Services. The \nweakness in foreign currencies relative to the U.S. dollar had a net unfavorable year-over-year impact on Rest of Asia Pacific net \nsales during 2024. \n\n                                               Apple Inc. | 2024 Form 10-K | 22 \n<<<\x0c\n\nProducts and Services Performance \nThe following table shows net sales by category for 2024, 2023 and 2022 (dollars in millions): \n                                                       2024        Change         2023        Change         2022 \niPhone                                             $   201,183         -   % $    200,583          (2)% $     205,489 \nMac                                                     29,984          2 %         29,357        (27)%        40,177 \niPad                                                     26,694         (6)%        28,300         (3)%        29,292 \nWearables, Home and Accessories                          37,005         (7)%        39,845         (3)%        41,241 \nServices (1)                                             96,169        13 %         85,200         9 %         78,129 \n    Total net sales                                $   391,035          2 % $     383,285          (3)% $     394,328 \n\n    (1) Services net sales include amortization of the deferred value of services bundled in the sales price of certain products. \n\niPhone \niPhone net sales were relatively flat during 2024 compared to 2023.', 'source': 'Apple-10-Q4-2024-As-Filed.txt', 'chunk_index': 50, 'score': 0.5906},

{'text': 'For third-party \napplications sold through the App Store, the Company does not obtain control of the product before transferring it to the \ncustomer. Therefore, the Company accounts for all third-party application-related sales on a net basis by recognizing in Services \nnet sales only the commission it retains. \n\n                                                 Apple Inc. 2025 Form 10-K | 35 \n<<<\x0c\n\nThe following table shows disaggregated net sales, as well as the portion of total net sales that was previously deferred, for \n2025, 2024 and 2023 (in millions): \n                                                                            2025            2024            2023 \niPhone                                                                  $     209,586   $     201,183 $       200,583 \nMac                                                                            33,708          29,984          29,357 \niPad                                                                           28,023          26,694          28,300 \nWearables, Home and Accessories                                                35,686          37,005          39,845 \nServices (1)                                                                  109,158          96,169          85,200 \n    Total net sales                                                     $     416,161   $     391,035   $     383,285 \n\nPortion of total net sales that was included in deferred revenue as of the \n  beginning of the period                                               $       8,229   $       7,728   $       8,169 \n\n    (1) Services net sales include amortization of the deferred value of services bundled in the sales price of certain products. \n\nThe Company\'s proportion of net sales by disaggregated revenue source was generally consistent for each reportable segment \nin Note 13, "Segment Information and Geographic Data" for 2025, 2024 and 2023, except in Greater China, where iPhone \nrevenue represented a moderately higher proportion of net sales. \n\nAs of September 27, 2025 and September 28, 2024, the Company had total deferred revenue of $13.7 billion and $12.8 billion, \nrespectively. As of September 27, 2025, the Company expects 66% of total deferred revenue to be realized in less than a year, \n23% within one-to-two years, 9% within two-to-three years and 2% in greater than three years.', 'source': 'Apple_10-K-2025-As-Filed.txt', 'chunk_index': 71, 'score': 0.5882},

{'text': 'For \nthese arrangements, the Company does not have a right to bill for the undelivered services. The Company has determined that \nany unbilled consideration relates entirely to the value of the undelivered services. Accordingly, the Company has not recognized \nrevenue, and does not disclose amounts, related to these undelivered services. \n\nFor the sale of third-party products where the Company obtains control of the product before transferring it to the customer, the \nCompany recognizes revenue based on the gross amount billed to customers. The Company considers multiple factors when \ndetermining whether it obtains control of third-party products, including evaluating if it can establish the price of the product, \nretains inventory risk for tangible products or has the responsibility for ensuring acceptability of the product. For third-party \napplications sold through the App Store, the Company does not obtain control of the product before transferring it to the \ncustomer. Therefore, the Company accounts for all third-party application-related sales on a net basis by recognizing in Services \nnet sales only the commission it retains. \n\nNet sales disaggregated by significant products and services for 2024, 2023 and 2022 were as follows (in millions): \n                                                                                 2024             2023            2022 \n iPhone                                                                     $     201,183   $      200,583   $      205,489 \n Mac                                                                               29,984           29,357           40,177 \n iPad                                                                              26,694           28,300           29,292 \n Wearables, Home and Accessories                                                   37,005           39,845           41,241 \n Services (1)                                                                      96,169           85,200           78,129 \n     Total net sales                                                        $     391,035    $     383,285   $      394,328 \n\n     (1) Services net sales include amortization of the deferred value of services bundled in the sales price of certain products.', 'source': 'Apple-10-Q4-2024-As-Filed.txt', 'chunk_index': 69, 'score': 0.5637},

{'text': "Fiscal Period \nThe Company's fiscal year is the 52- or 53-week period that ends on the last Saturday of September. An additional week is \nincluded in the first fiscal quarter every five or six years to realign the Company's fiscal quarters with calendar quarters, which \noccurred in the first quarter of 2023. The Company's fiscal years 2024 and 2022 spanned 52 weeks each, whereas fiscal year \n2023 spanned 53 weeks. \n\nMacroeconomic Conditions \nMacroeconomic conditions, including inflation, interest rates and currency fluctuations, have directly and indirectly impacted, and \ncould in the future materially impact, the Company's results of operations and financial condition. \n\n                                                Apple Inc. 2024 Form 10-K | 21 \n<<<\x0c\n\nSegment Operating Performance \nThe following table shows net sales by reportable segment for 2024, 2023 and 2022 (dollars in millions): \n                                                       2024         Change        2023         Change         2022 \nAmericas                                           $    167,045          3 % $     162,560          (4)% $     169,658 \nEurope                                                  101,328          7 %        94,294          (1)%        95,118 \nGreater China                                            66,952         (8)%        72,559          (2)%        74,200 \nJapan                                                    25,052          3 %        24,257          (7)%        25,977 \nRest of Asia Pacific                                     30,658          4 %        29,615          1 %         29,375 \n     Total net sales                               $    391,035          2 % $     383,285          (3)% $    394,328 \n\nAmericas \nAmericas net sales increased during 2024 compared to 2023 due primarily to higher net sales of Services. \n\nEurope \nEurope net sales increased during 2024 compared to 2023 due primarily to higher net sales of Services and iPhone. \n\nGreater China \nGreater China net sales decreased during 2024 compared to 2023 due primarily to lower net sales of iPhone and iPad. The \nweakness in the renminbi relative to the U.S.", 'source': 'Apple-10-Q4-2024-As-Filed.txt', 'chunk_index': 49, 'score': 0.5568}
This query produced the most instructive result of the three, not because the system returned a great answer, but because it returned an honest one.
The corpus contains only annual 10-K filings; there are no 10-Q documents with quarterly iPhone revenue breakdowns. Rather than extrapolating from annual figures or fabricating a quarterly trend, the model correctly identified the gap, answered what the context did support, and explicitly flagged what was missing.
That behavior is a direct consequence of the prompt instruction: tell the model to admit uncertainty rather than extrapolate. A model without that guardrail would likely have divided annual figures by four and presented a plausible-looking quarterly trend. This one didn’t.
The multi-column annual table – four fiscal years, five product rows – arrived intact from both filings and was read correctly. The limitation wasn’t in the parsing or the retrieval. It was in the corpus. The system knew the difference.
The Same Query, Two Worlds
Query 1 demonstrated the pipeline working. Here’s what it would have returned on the same query with a traditional OCR parser upstream.
The FY 2024 gross margin table, run through a standard OCR tool, produces this:
2024 2023 2022 Gross margin Products 109,633 108,803 114,728
Services 71,050 60,345 56,054 Total gross margin 180,683 169,148
170,782 Gross margin percentage Products 37.2 36.5 36.3
Services 73.9 70.8 71.7 Total gross margin percentage 46.2 44.1 43.3
Column headers detached from their values. Year labels floating at the top with no structural association to the columns beneath them. Dollar figures and percentages collapsed into a single undifferentiated stream.
Embedded and stored as-is, this chunk retrieves on a gross margin query just as readily as the clean version – cosine similarity doesn’t know the table is broken. But what the model receives is a block of figures without reliable structure.
Asked for Apple’s gross margin for 2024, it has to infer which number belongs to which year and which segment. Sometimes it guesses right. Often it doesn’t.
In one test run against this corrupted chunk, the model returned 44.1% – FY 2023’s total gross margin percentage, not FY 2024’s 46.2% – with full confidence and a source citation.
That is the failure mode Part 1 described: no exception raised, no warning logged, a plausible answer that is simply wrong. The user who doesn’t have Apple’s financials memorized has no way to catch it.
Only one variable changed. The parser. Everything else – the query, the embedding model, the vector database, the LLM – stayed identical.
That’s a clear result: retrieval quality starts at the document parsing layer, and not one step later.
Fix Your OCR Pipeline in RAG: Conclusion
A RAG system is a chain of dependencies.
The LLM depends on what retrieval hands it. Retrieval depends on what the vector database indexed. The vector database indexed what the embedding model encoded. The embedding model encoded what the parser extracted. Pull on that chain from the wrong end – tuning the LLM, swapping embedding models, experimenting with retrieval parameters – and you’re optimizing components that were never the bottleneck.
The bottleneck, for most real-world document corpora, is at the front. Not because parsing is technically unsolved, but because it’s the step that gets the least scrutiny. It runs, it produces output, the pipeline continues. No one checks whether the table that just got parsed still has its columns in the right order.
LLMWhisperer is built for the developers who’ve learned that lesson the hard way – or who’d rather not. It handles the part of the pipeline that silently determines the quality of everything downstream: turning complex, messy, real-world documents into text that an LLM can actually reason over.The best way to see what that means for your specific documents is to try it. The LLMWhisperer API has a free tier – run your own PDFs through it, compare the output against what your current parser produces, and let the diff make the case.
Integrating OCR Pipelines into RAG: FAQ
1. Why does integrating OCR pipelines into RAG often fail silently, and how does LLMWhisperer fix this?
Traditional OCR pipelines corrupt tables, merge columns, and lose reading order—but don’t throw errors. This breaks the rag model workflow before embedding even starts. LLMWhisperer preserves layout and table integrity, ensuring clean input for the rag ocr stage.
2. How does LLMWhisperer improve the ocr pipeline in rag compared to traditional OCR tools?
Most OCR tools are built for human readability, not machine consumption. In an ocr pipeline in rag, LLMWhisperer outputs layout-preserving, structured text that chunks predictably and embeds accurately—unlike generic OCR that collapses tables and headers.
3. Can I use LLMWhisperer without changing my existing rag model workflow?
Yes. LLMWhisperer acts as a drop-in replacement for the parsing stage in any rag model workflow. You keep your chunking, embedding, and LLM layers intact—only the upstream parser changes.
4. How should scanned PDFs with tables be handled in a rag ocr pipeline?
Use LLMWhisperer in layout_preserving mode. It preserves table structure so your rag workflow retrieves correct row/column relationships—unlike traditional ocr for rag that flattens tables into noise.
5. How does LLMWhisperer affect rag workflow steps like chunking and retrieval?
By outputting clean, semantically coherent text, LLMWhisperer reduces mid-table splits and header bleed. This stabilizes every subsequent rag workflow stage—chunk boundaries stay meaningful, embeddings are less noisy, and retrieval precision improves.