Agentic Document Extraction & Processing with Unstract + Crew.AI
Table of Contents
Introduction
Financial statements are rich with valuable insights, but they typically arrive in formats that are anything but analysis-ready. Whether in PDFs, scanned documents, or lengthy text reports, the data is often buried in tables, footnotes, and inconsistent structures. Extracting meaningful, structured information from this unstructured content is a time-consuming and error-prone process if done manually.
This is where agentic workflows prove their worth. Instead of relying on static scripts or brittle parsing logic, agentic systems can dynamically coordinate tasks, extracting raw content, validating results, handling errors, and routing data through subsequent steps in the pipeline. For document processing, this approach ensures higher accuracy, greater flexibility, and reduced human effort.
By pairing Unstract’s ingestion and processing capabilities with Crew.AI’s agentic workflow orchestration, we can automate the end-to-end process of transforming raw financial statements into structured, validated datasets ready for analysis and storage.
Why Agentic Workflows?
At its core, agentic document extraction means breaking down the process of turning unstructured documents into structured data into a series of intelligent, collaborative steps carried out by specialized agents. Instead of a single monolithic script that tries to do everything, you delegate tasks to different agents, for example: one agent to parse text, another to validate extracted fields, and another to handle errors or missing values.
This design offers several advantages:
Automation – Routine, repetitive tasks like parsing, cleaning, and validating data are handled automatically, freeing up human time for higher-level review.
Modularity – Each agent focuses on a single responsibility, making the overall workflow easier to design, test, and maintain.
Extensibility – New agents can be introduced or existing ones swapped out without disrupting the rest of the pipeline. For instance, adding an enrichment agent to compute new financial metrics is as simple as plugging it into the workflow.
This is where Crew.AI comes in. Crew.AI is a framework built specifically to design, manage, and orchestrate agentic workflows. It allows developers to define different agents, assign them responsibilities, and coordinate their interactions seamlessly. With Crew.AI, document extraction isn’t just about getting data, it’s about building resilient, adaptable workflows that can scale with the complexity of real-world documents.
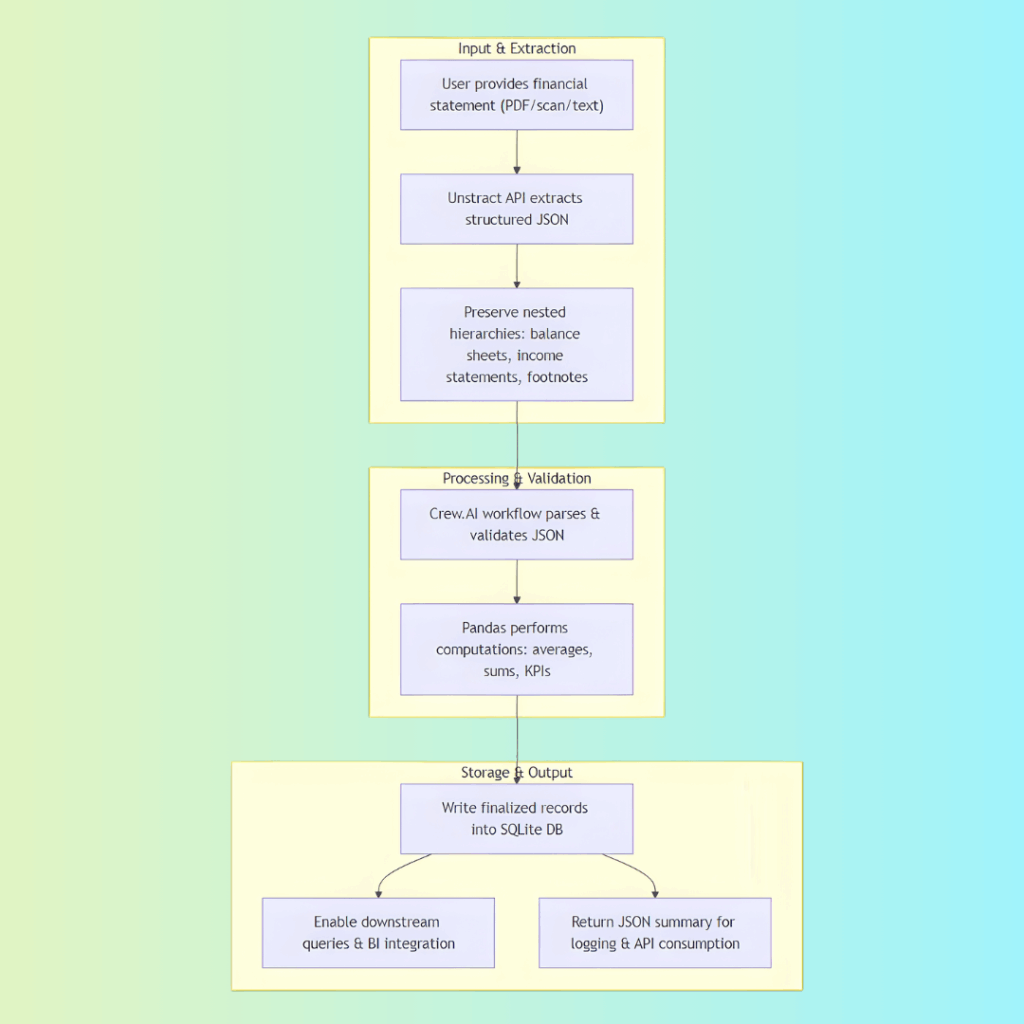
A user provides a financial statement (PDF, scanned report, or text-heavy file).
The Unstract API ingests the document and extracts structured JSON, preserving nested hierarchies such as balance sheets, income statements, and footnotes.
This avoids brittle methods like regex or OCR hacks, ensuring that the extracted data is both accurate and context-aware.
Processing & Validation
The structured JSON is passed into a Crew.AI workflow composed of specialized agents and tools.
Once validated, the dataset is analyzed using Pandas, enabling computations such as averages and sums.
Storage & Output
Finalized records are written into a SQLlite database (or any relational DB).
Structured tables allow downstream queries and integration with BI tools.
The workflow returns a JSON summary for logging, traceability, and potential API consumption.
Here is the GitHub repository where you will find all the codes written for this article.
Flow Diagram
By combining Unstract’s reliable document extraction with Crew.AI’s agentic orchestration, this workflow creates a robust, end-to-end system for financial data processing that is both scalable and adaptable.
Building the Workflow
Step 1: Document Ingestion with Unstract
Unstract’s Prompt Studio is a no-code environment for designing and fine-tuning AI prompts that extract structured data from unstructured sources such as PDFs, scanned reports or any other business documents.
In this guide, we’ll use Prompt Studio to define prompts that capture key fields from an economic report, in this case, the New Zealand Economic Report:
To get started, head over to the Unstract website and create a free account. The signup process is quick and unlocks access to Unstract’s core tools, including Prompt Studio and LLMWhisperer.
Every new account comes with a 14-day trial and 10M tokens in LLM credits, giving you everything you need to begin building and testing your own document extraction pipeline right away.
Setting Up Prompts
Open Prompt Studio in Unstract and create a new project based on your document type, for example, an economic report.
Explore Unstract’s Prompt Studio
Next, go to the Manage Documents section to upload the file you want to process. Once uploaded, you can begin crafting prompts to target the fields you want to extract.
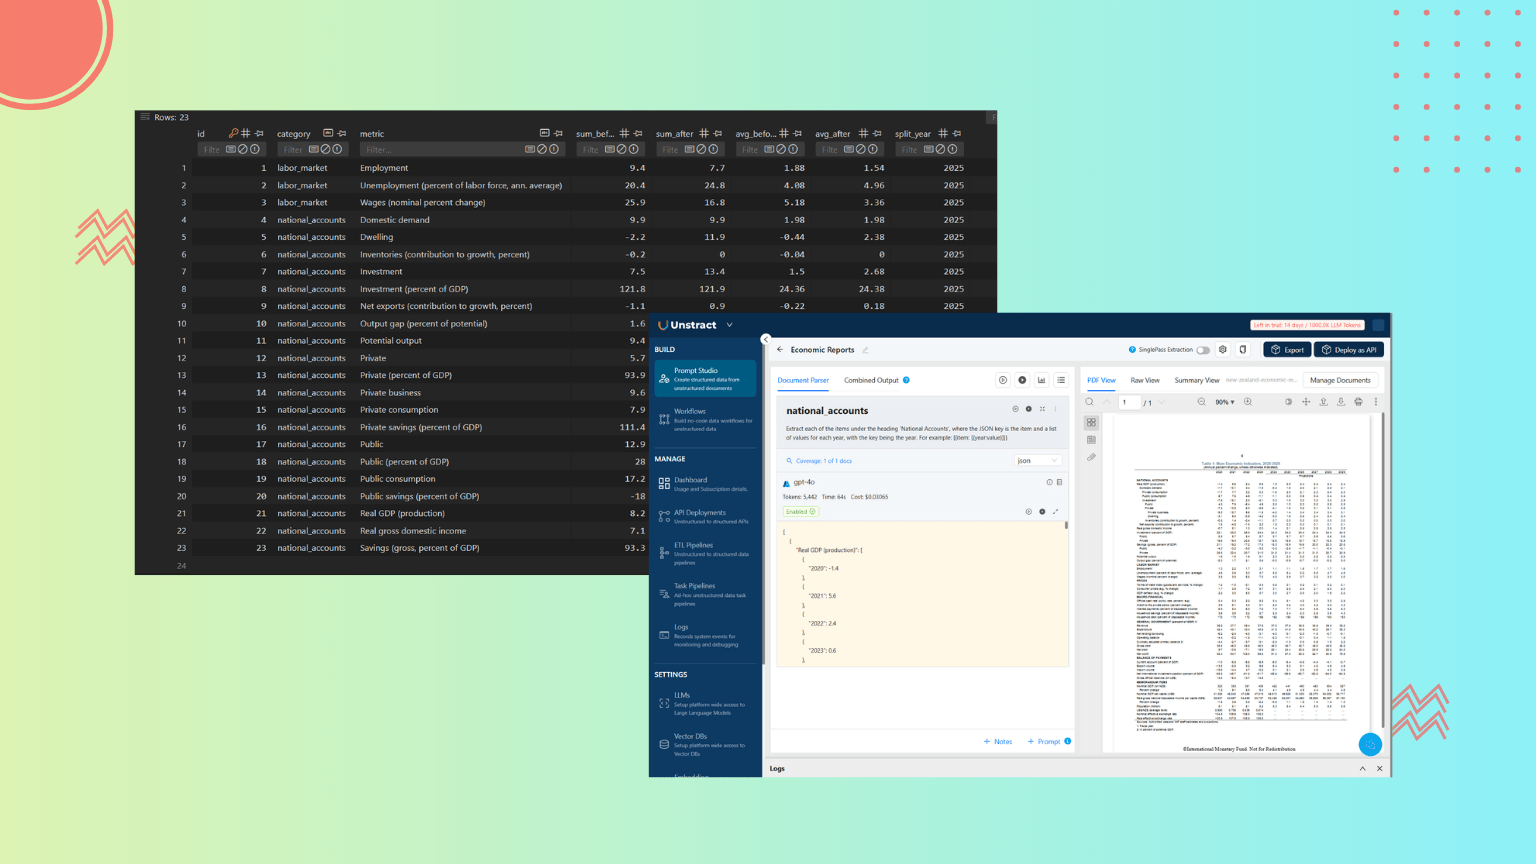
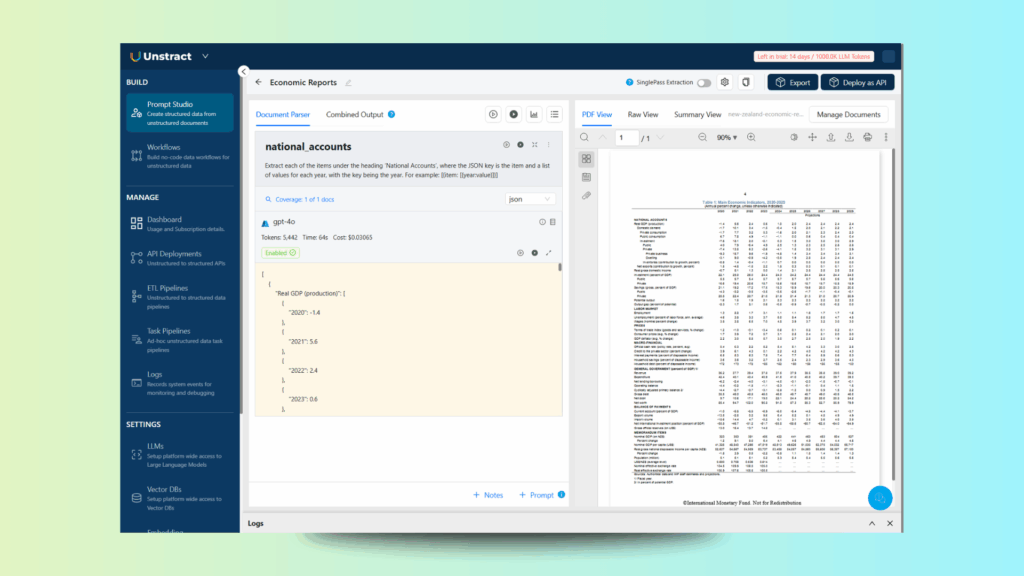
Prompts tell the AI exactly what to look for and how to structure the results. For instance, here’s a prompt designed to capture the National Accounts section:
Extract each of the items under the heading "National Accounts", where the JSON key is the item and a list of values for each year, with the key being the year. For example: [{item: [{year:value}]}]
Tip: Always set the output format to JSON to ensure clean, structured results.
When we run this prompt, it returns the following JSON:
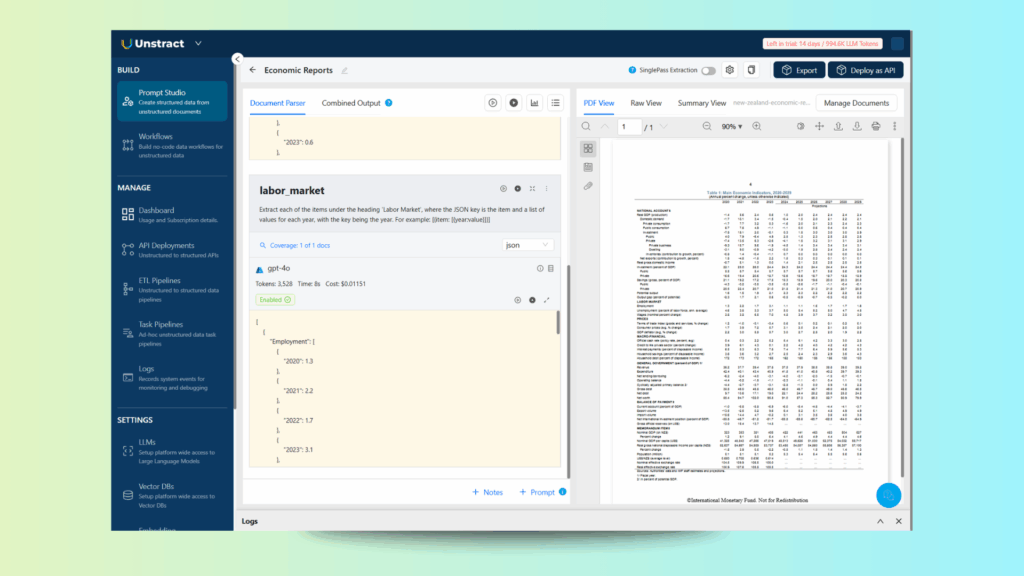
And the prompt is designed to capture the Labor Market section:
Extract each of the items under the heading 'Labor Market', where the JSON key is the item and a list of values for each year, with the key being the year. For example: [{item: [{year:value}]}]
Note: Set the output format to JSON to ensure properly structured results.
When we run this prompt, it generates the following JSON output:
Output Format
The extracted data is returned as structured JSON. Here’s an example of the combined output from multiple prompts:
With your prompts defined and tested, you’re ready to deploy them as an API. This allows you to integrate the extraction pipeline directly into your workflow or test it with tools like Postman.
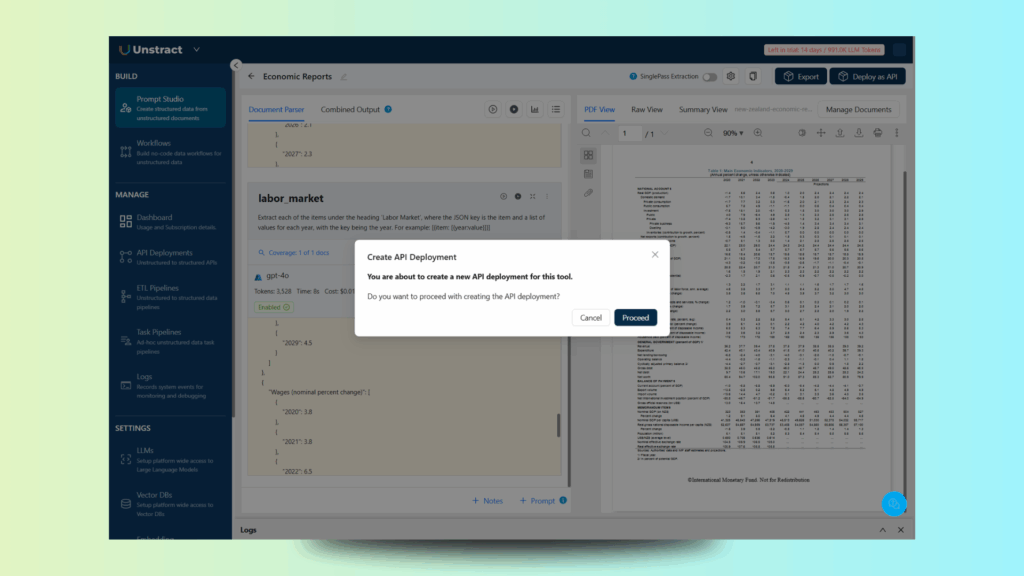
To deploy, simply click the “Deploy as API” button in the top-right corner of Prompt Studio. This will guide you through the deployment flow:
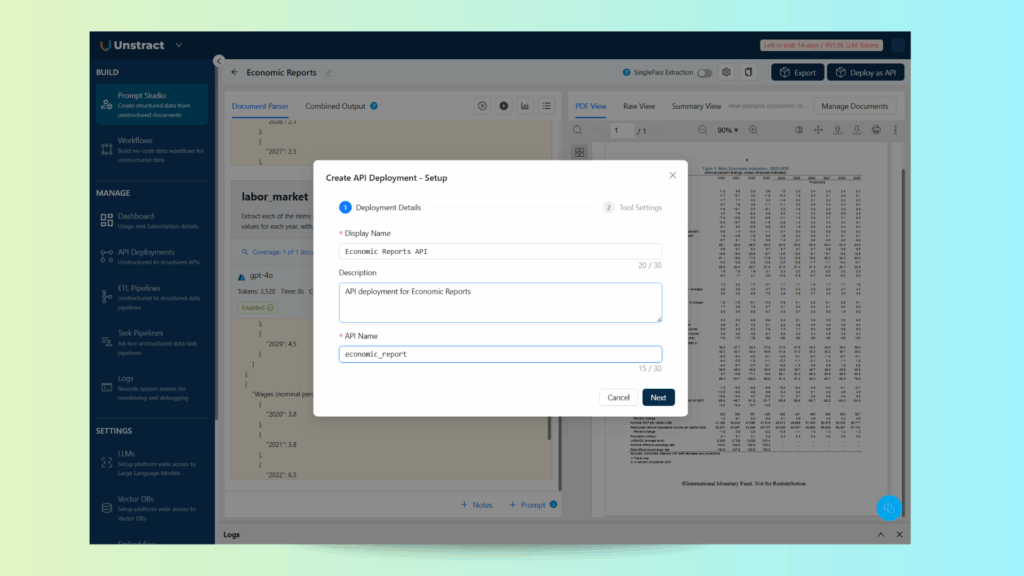
Let’s proceed and define a name for the API, in this case, `economic_report’:
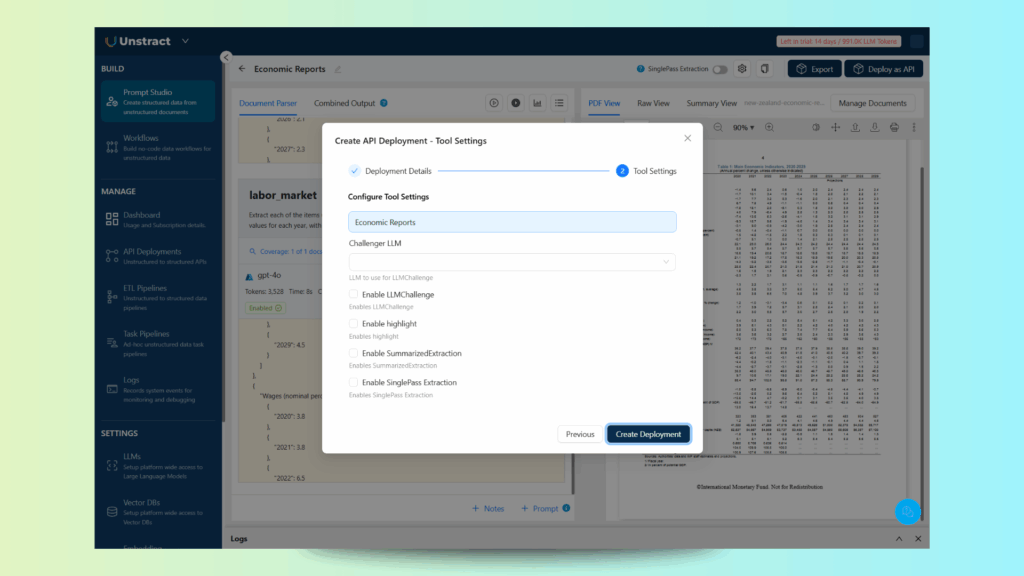
On the tool settings, you can leave the default values:
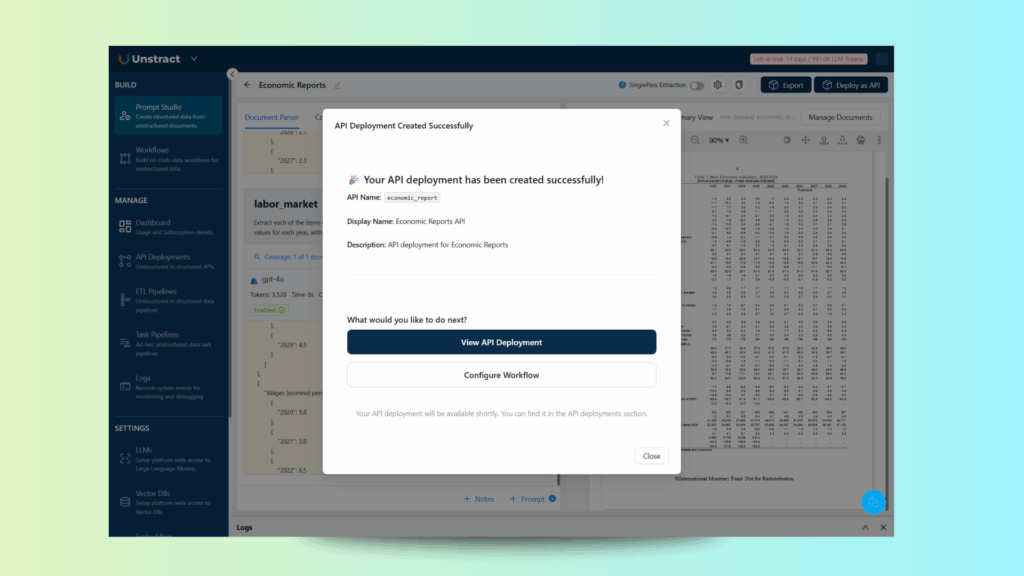
And after a few seconds, your API is deployed:
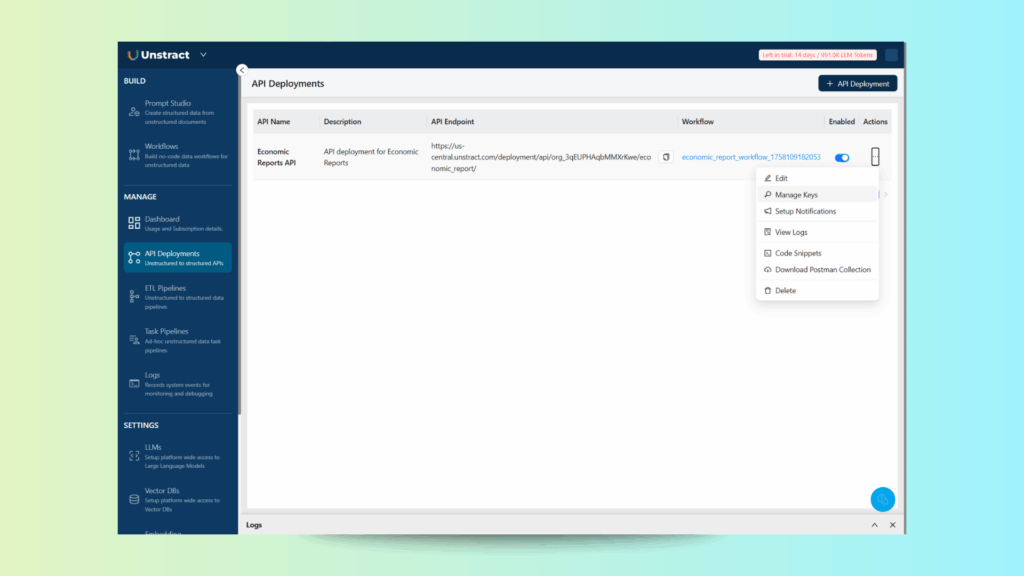
In the API deployment list, you can access the actions menu and download a Postman collection for testing and/or manage the API keys:
Retrieve the API key with ‘Manage Keys’ and write it down, as well as the API endpoint shown. You will need them later on.
Step 2: Data Extraction with Crew.AI Agents
With the Unstract API ready, we can now proceed to build the CrewAI integration.
Before getting started, make sure that uv is installed on your system, as CrewAI recommends using it. Follow the instructions for your operating system.
Install uv
macOS / Linux: Use curl to download and run the installer:
curl -LsSf https://astral.sh/uv/install.sh | sh
If your system doesn’t have curl, you can use wget instead:
wget -qO- https://astral.sh/uv/install.sh | sh
Windows: Use PowerShell to download and execute the installer:
If you encounter any issues during installation, refer to the UV installation guide for additional troubleshooting and details.
Install CrewAI
Install the crewai CLI: Run the following command:
uv tool install crewai
Create a new flow using CrewAI templates:
crewai create flow unstract_flow
Clean up unused directories: You can safely delete the crew directory inside src, as we won’t be using crews in this example. Later, we’ll define an agent in the code. Add dependencies: Update your pyproject.toml to include the required packages:
This setup ensures that CrewAI, along with its essential tools and dependencies, is ready for building your agentic workflow.
Building a Custom CrewAI Tool for Pandas
For processing the economic data returned by the Unstract API, we will use Pandas to compute key metrics such as averages and sums based on a configurable split year.
To accomplish this, we will create two tools:
Sum Tool – Aggregates numeric fields by summing values for each item across years, relative to the split year.
Average Tool – Calculates the average for each item across years, again considering the split year.
These tools will form the core data-processing components in our CrewAI workflow, allowing us to transform raw JSON from Unstract into meaningful, analysis-ready metrics.
The code will reside in the file custom_tools (this file was previously created):
from typing import Dict, Any
import json
import pandas as pd
from crewai.tools import tool


@tool("process_dataframe_sum")
def process_dataframe_sum(data: Dict[str, Any], split_year: int = 2025) -> str:
    """Process any nested dictionary data using pandas and return a processed DataFrame with the sum of the values
    before and after the split year.

    Args:
        data (Dict[str, Any]): The input data dictionary
        split_year (int): The year to split the data before and after (default: 2025)

    Returns:
        JSON string containing the aggregated data
    """
    return _process_dataframe(data, 'sum', split_year)


@tool("process_dataframe_avg")
def process_dataframe_avg(data: Dict[str, Any], split_year: int = 2025) -> str:
    """Process any nested dictionary data using pandas and return a processed DataFrame with the average of the values
    before and after the split year.

    Args:
        data (Dict[str, Any]): The input data dictionary
        split_year (int): The year to split the data before and after (default: 2025)

    Returns:
        JSON string containing the aggregated data
    """
    return _process_dataframe(data, 'avg', split_year)


# Define the function to process the data using Pandas
def _process_dataframe(data: Dict[str, Any], action: str = 'sum', split_year: int = 2025) -> str:
    print(f"process_dataframe called with action={action}, split_year={split_year}")

    # Validate action parameter
    if action not in ['sum', 'avg']:
        raise ValueError("Action must be either 'sum' or 'avg'")

    # Parse JSON if data is a string
    if isinstance(data, str):
        try:
            raw_data = json.loads(data)
        except json.JSONDecodeError as e:
            raise ValueError(f"Invalid JSON string: {e}")
    else:
        raw_data = data

    # Initialize lists to store the data
    metrics = []
    categories = []
    years = []
    values = []

    # Process each category (labor_market, national_accounts)
    for category, metrics_list in raw_data.items():
        # Process each metric dictionary in the list
        for metric_dict in metrics_list:
            # Each metric_dict has one key-value pair
            for metric_name, year_list in metric_dict.items():
                # Process each year dictionary in the list
                for year_dict in year_list:
                    # Each year_dict has one key-value pair
                    for year, value in year_dict.items():
                        metrics.append(metric_name)
                        categories.append(category)
                        years.append(int(year))  # Convert year to integer
                        values.append(float(value))  # Convert value to float

    # Create DataFrame
    df = pd.DataFrame({
        'Category': categories,
        'Metric': metrics,
        'Year': years,
        'Value': values
    })

    # Create separate DataFrames for before and after split_year
    df_before = df[df['Year'] < split_year].groupby(['Category', 'Metric'])['Value']
    df_after = df[df['Year'] >= split_year].groupby(['Category', 'Metric'])['Value']

    # Apply the specified action
    if action == 'sum':
        df_before = df_before.sum().reset_index()
        df_after = df_after.sum().reset_index()
        before_col = f'Sum_Before_{split_year}'
        after_col = f'Sum_After_{split_year}'
    else:  # action == 'avg'
        df_before = df_before.mean().reset_index()
        df_after = df_after.mean().reset_index()
        before_col = f'Avg_Before_{split_year}'
        after_col = f'Avg_After_{split_year}'

    # Rename the Value columns
    df_before = df_before.rename(columns={'Value': before_col})
    df_after = df_after.rename(columns={'Value': after_col})

    # Merge the two DataFrames
    result_df = pd.merge(df_before, df_after, on=['Category', 'Metric'])

    # Sort by Category and Metric
    result_df = result_df.sort_values(['Category', 'Metric'])

    # Round numeric columns to 2 decimal places
    numeric_cols = result_df.select_dtypes(include=['float64']).columns
    result_df[numeric_cols] = result_df[numeric_cols].round(2)

    # Return a JSON of the DataFrame
    return result_df.to_json(orient='records', indent=2)
This module defines two CrewAI tools for processing nested financial data returned by the Unstract API.
The tools leverage Pandas to aggregate values before and after a configurable split year.
process_dataframe_sum
Aggregates numeric values by summing them per metric and category.
Returns the result as a structured JSON string.
process_dataframe_avg
Computes the average of numeric values per metric and category.
Returns the result as a structured JSON string.
_process_dataframe
Converts nested dictionaries (or JSON strings) into a flat Pandas DataFrame.
Splits data based on the specified split_year.
Performs the aggregation (sum or avg) separately for values before and after the split year.
Returns a JSON-formatted summary containing the merged results for all categories and metrics.
Building the CrewAI Flow
Before building the flow, we need to set up access to an OpenAI LLM, as our agent will rely on it. If you don’t already have one, create an OpenAI API key here. Make a note of your API key, as you will need it later when running the CrewAI flow.
Now we are ready to build the flow in the main.py file:
#!/usr/bin/env python
import sqlite3
from typing import Dict, Any, List
from pydantic import BaseModel
from crewai.flow import Flow, listen, start
from crewai.agent import Agent
import os
import requests
from dotenv import load_dotenv
from unstract_flow.tools.custom_tool import process_dataframe_avg, process_dataframe_sum

# Load the environment variables
load_dotenv()

class EconomicAnalysis(BaseModel):
    category: str = ""  # The category of the economic data
    metric: str = ""  # The metric of the economic data
    sum_before: float = 0.0  # The sum of the economic data before the split year
    sum_after: float = 0.0  # The sum of the economic data after the split year
    avg_before: float = 0.0  # The average of the economic data before the split year
    avg_after: float = 0.0  # The average of the economic data after the split year
    split_year: int = 0  # The year to split the economic data

class EconomicAnalysisList(BaseModel):
    analysis: List[EconomicAnalysis] = []  # The analysis of the economic data

class FlowState(BaseModel):
    filename: str = "new-zealand-economic-report-1.pdf"  # The filename of the PDF to process
    has_error: bool = False  # Whether there was an error processing the PDF
    error_message: str = ""  # The error message if there was an error processing the PDF
    data: Dict[str, Any] = {}  # The data extracted from the PDF
    analysis: EconomicAnalysisList = EconomicAnalysisList()  # The analysis of the economic data


class UnstractFlow(Flow[FlowState]):

    @start()
    def process_pdf(self):
        print("Processing PDF, using filename: ", self.state.filename)

        try:
            # Define the API URL and headers
            api_url = os.getenv('UNSTRACT_API_URL')
            headers = {
                'Authorization': 'Bearer ' + os.getenv('UNSTRACT_API_KEY')
            }
            # Define the payload
            payload = {'timeout': 300, 'include_metadata': False}
            # Define the files
            files=[('files',('file',open(self.state.filename,'rb'),'application/octet-stream'))]  # The files to process
            # Make the request
            response = requests.post(api_url, headers=headers, data=payload, files=files)
            # Set the state
            self.state.has_error = False
            self.state.error_message = ""
            self.state.data = response.json()['message']['result'][0]['result']['output']
            print("PDF processed successfully")
        except Exception as e:
            # Set the state
            self.state.has_error = True
            self.state.error_message = str(e)
            self.state.data = {}
            print("Error processing PDF: ", self.state.error_message)

    @listen(process_pdf)
    async def process_data(self):
        print("Processing data")
        try:
            # Create an Agent for market research
            analyst = Agent(
                role="Economic Analyst",
                goal=f"Analyze the economic data for {self.state.filename}",
                backstory="You are an experienced economic analyst with expertise in "
                    "identifying economic trends and opportunities.",
                tools=[process_dataframe_sum, process_dataframe_avg],
                verbose=True,
            )

            # Define the research query
            query = f"""
            For the economic data for {self.state.filename}, please analyze the data and provide a summary of the data.

            The data is in the following format:
            {self.state.data}

            Format your response according to the specified structure.
            """

            # Execute the analysis with structured output format
            result = await analyst.kickoff_async(query, response_format=EconomicAnalysisList)

            # Set the state
            self.state.analysis = result.pydantic
            print("Data processed successfully")
        except Exception as e:
            # Set the state
            self.state.has_error = True
            self.state.error_message = str(e)
            self.state.analysis = {}
            print("Error processing data: ", self.state.error_message)


    @listen(process_data)
    def save_to_database(self):
        print("Saving to database")
        try:
            # Open a connection to the database
            conn = sqlite3.connect('economic_data.db')

            # Create a table for the analysis
            conn.execute('''CREATE TABLE IF NOT EXISTS analysis (
                id INTEGER PRIMARY KEY AUTOINCREMENT,
                category TEXT,
                metric TEXT,
                sum_before REAL,
                sum_after REAL,
                avg_before REAL,
                avg_after REAL,
                split_year INTEGER
            )''')

            # Insert the analysis into the database
            for analysis in self.state.analysis.analysis:
                conn.execute('''INSERT INTO analysis (category, metric, sum_before, sum_after, avg_before, avg_after, split_year) VALUES (?, ?, ?, ?, ?, ?, ?)''',
                (analysis.category, analysis.metric, analysis.sum_before, analysis.sum_after, analysis.avg_before, analysis.avg_after, analysis.split_year))

            # Commit the changes
            conn.commit()

            # Close the connection
            conn.close()
            print("Data saved to database successfully")
        except Exception as e:
            self.state.has_error = True
            self.state.error_message = str(e)
            print("Error saving to database: ", self.state.error_message)
        finally:
            # Close the connection
            conn.close()


def kickoff():
    unstract_flow = UnstractFlow()
    unstract_flow.kickoff(inputs={"filename": "new-zealand-economic-report-1.pdf"})


def plot():
    unstract_flow = UnstractFlow()
    unstract_flow.plot()


if __name__ == "__main__":
    kickoff()
This script defines a CrewAI flow that automates the process of extracting, analyzing, and storing economic data from PDFs using Unstract API, Pandas, and an OpenAI-powered agent. It also persists results in a SQLite database.
Pydantic Models
EconomicAnalysis: Represents a single metric analysis, including sum/average before and after a split year.
EconomicAnalysisList: Holds a list of EconomicAnalysis objects.
FlowState: Maintains the flow state, including filename, error handling, extracted data, and analysis results.
Using Pydantic models in a CrewAI flow ensures that all data shared between the flow, agent, and tools is validated, structured, and consistent. By enforcing type checks, required fields, and nested data structures, Pydantic prevents invalid or malformed data from propagating through the workflow, catches errors early, and guarantees that aggregated results like sums and averages are correctly formatted.
CrewAI Flow Class, UnstractFlow, inherits from Flow[FlowState] and orchestrates the entire pipeline:
Then, navigate to the unstract-flow directory and install all dependencies using the CrewAI CLI:
crewai install
Once dependencies are installed, run your flow:
crewai flow kickoff
The flow will start executing and progress through each step of the workflow, from PDF processing to data analysis and finally storing the results in the database.
Flow Processing PDF
It will first process the PDF with the Unstract API:
Running the Flow
╭──────────────────────────────────────────────────────────────────────────── Flow Execution ────────────────────────────────────────────────────────────────────────────╮
│                                                                                                                                                                        │
│  Starting Flow Execution                                                                                                                                               │
│  Name: UnstractFlow                                                                                                                                                    │
│  ID: 53dc4f7d-c2b9-430b-8d68-d8822a4efc7f                                                                                                                              │
│  Tool Args:                                                                                                                                                            │
│                                                                                                                                                                        │
│                                                                                                                                                                        │
╰────────────────────────────────────────────────────────────────────────────────────────────────────────────────────────────────────────────────────────────────────────╯

 Flow started with ID: 53dc4f7d-c2b9-430b-8d68-d8822a4efc7f
Processing PDF, using filename:  new-zealand-economic-report-1.pdf
PDF processed successfully
Flow Processing Data with Pandas
Then, the data processing with Pandas:
Processing data
LiteAgent: Economic Analyst
Status: In Progress
╭────────────────────────────────────────────────────────────────────────── LiteAgent Started ───────────────────────────────────────────────────────────────────────────╮
│ │
│ LiteAgent Session Started │
│ Name: Economic Analyst │
│ id: 0277923a-086b-4a3c-9018-276ed8c38bd2 │
│ role: Economic Analyst │
│ goal: Analyze the economic data for new-zealand-economic-report-1.pdf │
│ backstory: You are an experienced economic analyst with expertise in identifying economic trends and opportunities. │
│ tools: [CrewStructuredTool(name='process_dataframe_sum', description='Tool Name: process_dataframe_sum │
│ Tool Arguments: {'data': {'description': None, 'type': 'dict[str, Any]'}, 'split_year': {'description': None, 'type': 'int'}} │
│ Tool Description: Process any nested dictionary data using pandas and return a processed DataFrame with the sum of the values │
│ before and after the split year. │
│ │
│ Args: │
│ data (Dict[str, Any]): The input data dictionary │
│ split_year (int): The year to split the data before and after (default: 2025) │
│ │
│ Returns: │
│ JSON string containing the aggregated data │
│ '), CrewStructuredTool(name='process_dataframe_avg', description='Tool Name: process_dataframe_avg │
│ Tool Arguments: {'data': {'description': None, 'type': 'dict[str, Any]'}, 'split_year': {'description': None, 'type': 'int'}} │
│ Tool Description: Process any nested dictionary data using pandas and return a processed DataFrame with the average of the values │
│ before and after the split year. │
│ │
│ Args: │
│ data (Dict[str, Any]): The input data dictionary │
│ split_year (int): The year to split the data before and after (default: 2025) │
│ │
│ Returns: │
│ JSON string containing the aggregated data │
│ ')] │
│ verbose: True │
│ Tool Args: │
│ │
│ │
╰────────────────────────────────────────────────────────────────────────────────────────────────────────────────────────────────────────────────────────────────────────╯
process_dataframe called with action=sum, split_year=2025
LiteAgent: Economic Analyst
Status: In Progress
└── Using process_dataframe_sum (1)
╭─────────────────────────────────────────────────────────────────────── Agent Tool Execution ────────────────────────────────────────────────────────────────────────╮
│ │
│ Agent: Economic Analyst │
│ │
│ Thought: Thought: I need to analyze the economic data for New Zealand, focusing on summing and averaging metrics before and after the split year of 2025. │
│ │
│ Using Tool: process_dataframe_sum │
│ │
╰────────────────────────────────────────────────────────────────────────────────────────────────────────────────────────────────────────────────────────────────────────╯
╭────────────────────────────────────────────────────────────────────────────── Tool Input ──────────────────────────────────────────────────────────────────────────────╮
│ │
│ "{\"data\": {\"labor_market\": [{\"Employment\": [{\"2020\": 1.3}, {\"2021\": 2.2}, {\"2022\": 1.7}, {\"2023\": 3.1}, {\"2024\": 1.1}, {\"2025\": 1.1}, {\"2026\": │
│ 1.6}, {\"2027\": 1.7}, {\"2028\": 1.7}, {\"2029\": 1.6}]}, {\"Unemployment (percent of labor force, ann. average)\": [{\"2020\": 4.6}, {\"2021\": 3.8}, {\"2022\": │
│ 3.3}, {\"2023\": 3.7}, {\"2024\": 5.0}, {\"2025\": 5.4}, {\"2026\": 5.2}, {\"2027\": 5.0}, {\"2028\": 4.7}, {\"2029\": 4.5}]}, {\"Wages (nominal percent change)\": │
│ [{\"2020\": 3.8}, {\"2021\": 3.8}, {\"2022\": 6.5}, {\"2023\": 7.0}, {\"2024\": 4.8}, {\"2025\": 3.9}, {\"2026\": 3.7}, {\"2027\": 3.2}, {\"2028\": 3.0}, {\"2029\": │
... │
│ │
╰────────────────────────────────────────────────────────────────────────────────────────────────────────────────────────────────────────────────────────────────────────╯
╭───────────────────────────────────────────────────────────────────────────── Tool Output ──────────────────────────────────────────────────────────────────────────────╮
│ │
│ [ │
│ { │
│ "Category":"labor_market", │
│ "Metric":"Employment", │
│ "Sum_Before_2025":9.4, │
│ "Sum_After_2025":7.7 │
│ }, │
│ { │
│ "Category":"labor_market", │
│ "Metric":"Unemployment (percent of labor force, ann. average)", │
... │
│ │
╰────────────────────────────────────────────────────────────────────────────────────────────────────────────────────────────────────────────────────────────────────────╯
process_dataframe called with action=avg, split_year=2025
LiteAgent: Economic Analyst
Status: In Progress
├── Using process_dataframe_sum (1)
└── Using process_dataframe_avg (1)
╭─────────────────────────────────────────────────────────────────────── Agent Tool Execution ────────────────────────────────────────────────────────────────────────╮
│ │
│ Agent: Economic Analyst │
│ │
│ Thought: Thought: I will now calculate the average values for the same metrics before and after the split year of 2025. │
│ │
│ Using Tool: process_dataframe_avg │
│ │
╰────────────────────────────────────────────────────────────────────────────────────────────────────────────────────────────────────────────────────────────────────────╯
╭────────────────────────────────────────────────────────────────────────────── Tool Input ──────────────────────────────────────────────────────────────────────────────╮
│ │
│ "{\"data\": {\"labor_market\": [{\"Employment\": [{\"2020\": 1.3}, {\"2021\": 2.2}, {\"2022\": 1.7}, {\"2023\": 3.1}, {\"2024\": 1.1}, {\"2025\": 1.1}, {\"2026\": │
│ 1.6}, {\"2027\": 1.7}, {\"2028\": 1.7}, {\"2029\": 1.6}]}, {\"Unemployment (percent of labor force, ann. average)\": [{\"2020\": 4.6}, {\"2021\": 3.8}, {\"2022\": │
... │
│ │
╰────────────────────────────────────────────────────────────────────────────────────────────────────────────────────────────────────────────────────────────────────────╯
╭───────────────────────────────────────────────────────────────────────────── Tool Output ──────────────────────────────────────────────────────────────────────────────╮
│ │
│ [ │
│ { │
│ "Category":"labor_market", │
│ "Metric":"Employment", │
│ "Avg_Before_2025":1.88, │
│ "Avg_After_2025":1.54 │
│ }, │
│ { │
│ "Category":"labor_market", │
│... │
│ │
╰────────────────────────────────────────────────────────────────────────────────────────────────────────────────────────────────────────────────────────────────────────╯
LiteAgent: Economic Analyst
Status: In Progress
├── Using process_dataframe_sum (1)
├── Using process_dataframe_avg (1)
└── Thinking...
╭──────────────────────────────────────────────────────────────────────── ✅ Agent Final Answer ─────────────────────────────────────────────────────────────────────────╮
│ │
│ Agent: Economic Analyst │
│ │
│ Final Answer: │
│ { │
│ "analysis": [ │
│ { │
│ "category": "labor_market", │
│ "metric": "Employment", │
│ "sum_before": 9.4, │
│ "sum_after": 7.7, │
│ "avg_before": 1.88, │
│ "avg_after": 1.54, │
│ "split_year": 2025 │
│ }, │
│ { │
│ "category": "labor_market", │
│ "metric": "Unemployment (percent of labor force, ann. average)", │
... │
│ │
╰────────────────────────────────────────────────────────────────────────────────────────────────────────────────────────────────────────────────────────────────────────╯
✅ LiteAgent: Economic Analyst
Status: Completed
├── Using process_dataframe_sum (1)
├── Using process_dataframe_avg (1)
└── Thinking...
╭───────────────────────────────────────────────────────────────────────── LiteAgent Completion ─────────────────────────────────────────────────────────────────────────╮
│ │
│ LiteAgent Completed │
│ Name: Economic Analyst │
│ id: 0277923a-086b-4a3c-9018-276ed8c38bd2 │
│ role: Economic Analyst │
│ goal: Analyze the economic data for new-zealand-economic-report-1.pdf │
│ backstory: You are an experienced economic analyst with expertise in identifying economic trends and opportunities. │
│ tools: [CrewStructuredTool(name='process_dataframe_sum', description='Tool Name: process_dataframe_sum │
│ Tool Arguments: {'data': {'description': None, 'type': 'dict[str, Any]'}, 'split_year': {'description': None, 'type': 'int'}} │
│ Tool Description: Process any nested dictionary data using pandas and return a processed DataFrame with the sum of the values │
│ before and after the split year. │
│ │
│ Args: │
│ data (Dict[str, Any]): The input data dictionary │
│ split_year (int): The year to split the data before and after (default: 2025) │
│ │
│ Returns: │
│ JSON string containing the aggregated data │
│ '), CrewStructuredTool(name='process_dataframe_avg', description='Tool Name: process_dataframe_avg │
│ Tool Arguments: {'data': {'description': None, 'type': 'dict[str, Any]'}, 'split_year': {'description': None, 'type': 'int'}} │
│ Tool Description: Process any nested dictionary data using pandas and return a processed DataFrame with the average of the values │
│ before and after the split year. │
│ │
│ Args: │
│ data (Dict[str, Any]): The input data dictionary │
│ split_year (int): The year to split the data before and after (default: 2025) │
│ │
│ Returns: │
│ JSON string containing the aggregated data │
│ ')] │
│ verbose: True │
│ Tool Args: │
│ │
│ │
╰────────────────────────────────────────────────────────────────────────────────────────────────────────────────────────────────────────────────────────────────────────╯
Data processed successfully
Note: Output abbreviated for clarity
The CrewAI flow executes the economic data analysis in a step-by-step, agent-driven manner. The LiteAgent “Economic Analyst” starts by ingesting the PDF data and sequentially uses the process_dataframe_sum and process_dataframe_avg tools to compute sums and averages before and after the split year (2025).
Throughout execution, the agent logs its progress, tool inputs, outputs, and intermediate thoughts. Once all calculations are complete, the agent compiles the final structured JSON analysis, which includes category, metric, summed values, averaged values, and the split year, and marks the workflow as successfully completed.
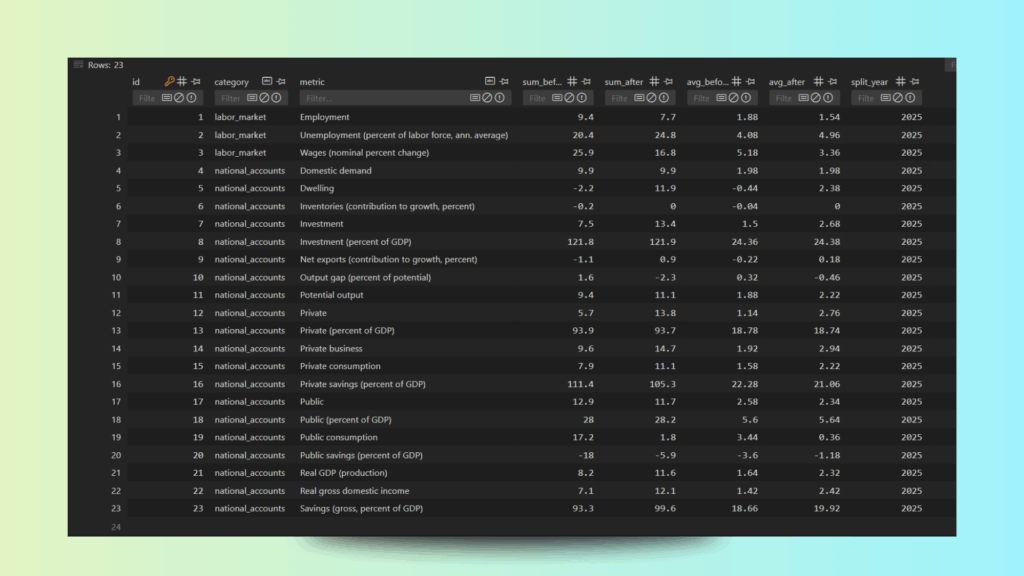
After execution, the processed economic data will be aggregated and stored in the SQLite database, ready for querying, analysis, or downstream workflows:
Why Unstract is Key to Accurate Document Processing
While Crew.AI provides the agentic orchestration to parse, validate, and manage tasks, Unstract plays a critical role as the foundation of the workflow. Financial statements and other business documents are often messy: tables are inconsistent, footnotes are nested, and formats vary widely between companies. Without cleanly structured input, even the smartest agents can struggle to produce reliable results.
Unstract addresses this challenge by:
Reliable Document Ingestion – Converts PDFs, scanned files, or text-heavy documents into structured JSON while preserving nested data hierarchies.
Accuracy Over Hacks – Avoids brittle solutions like regex parsing or low-quality OCR, reducing errors and misinterpretations.
Seamless Integration – Provides ready-to-use structured data that Crew.AI agents can immediately process, enabling smooth downstream validation, analysis, and storage.
Unstract ensures that the workflow starts on the right footing, giving Crew.AI the clean, consistent data it needs to operate effectively. By combining these two tools, the workflow achieves both robust data extraction and intelligent task orchestration, making the end-to-end process faster, more reliable, and scalable.
Conclusion
By combining Unstract’s document ingestion with Crew.AI’s agentic workflow orchestration, we’ve created a pipeline that transforms messy, unstructured financial statements into clean, validated, and analysis-ready datasets. The result is a workflow that offers automation (removing repetitive manual work), modularity (breaking tasks into specialized agents and tools), and reliability (ensuring data is validated, logged, and stored consistently).
While we’ve focused here on financial statements, the same approach can be extended to a wide variety of document types, such as contracts, invoices, compliance reports, or regulatory filings. Each use case can leverage Crew.AI agents tailored for domain-specific validation and analysis, making the system both flexible and future-proof.
This lays the foundation for more advanced applications, from AI-driven business intelligence pipelines to compliance automation.
UNSTRACT
AI Driven Document Processing
The platform purpose-built for LLM-powered unstructured data extraction. Try Playground for free. No sign-up required.
Nuno Bispo is a Senior Software Engineer with more than 15 years of experience in software development.
He has worked in various industries such as insurance, banking, and airlines, where he focused on building software using low-code platforms.
Currently, Nuno works as an Integration Architect for a major multinational corporation.
He has a degree in Computer Engineering.
Necessary cookies help make a website usable by enabling basic functions like page navigation and access to secure areas of the website. The website cannot function properly without these cookies.
Marketing cookies are used to track visitors across websites. The intention is to display ads that are relevant and engaging for the individual user and thereby more valuable for publishers and third party advertisers.
Preference cookies enable a website to remember information that changes the way the website behaves or looks, like your preferred language or the region that you are in.